Docking, tabs, floating panels, multi-monitor, multi-DOM, link groups, and the built-in desk presets.
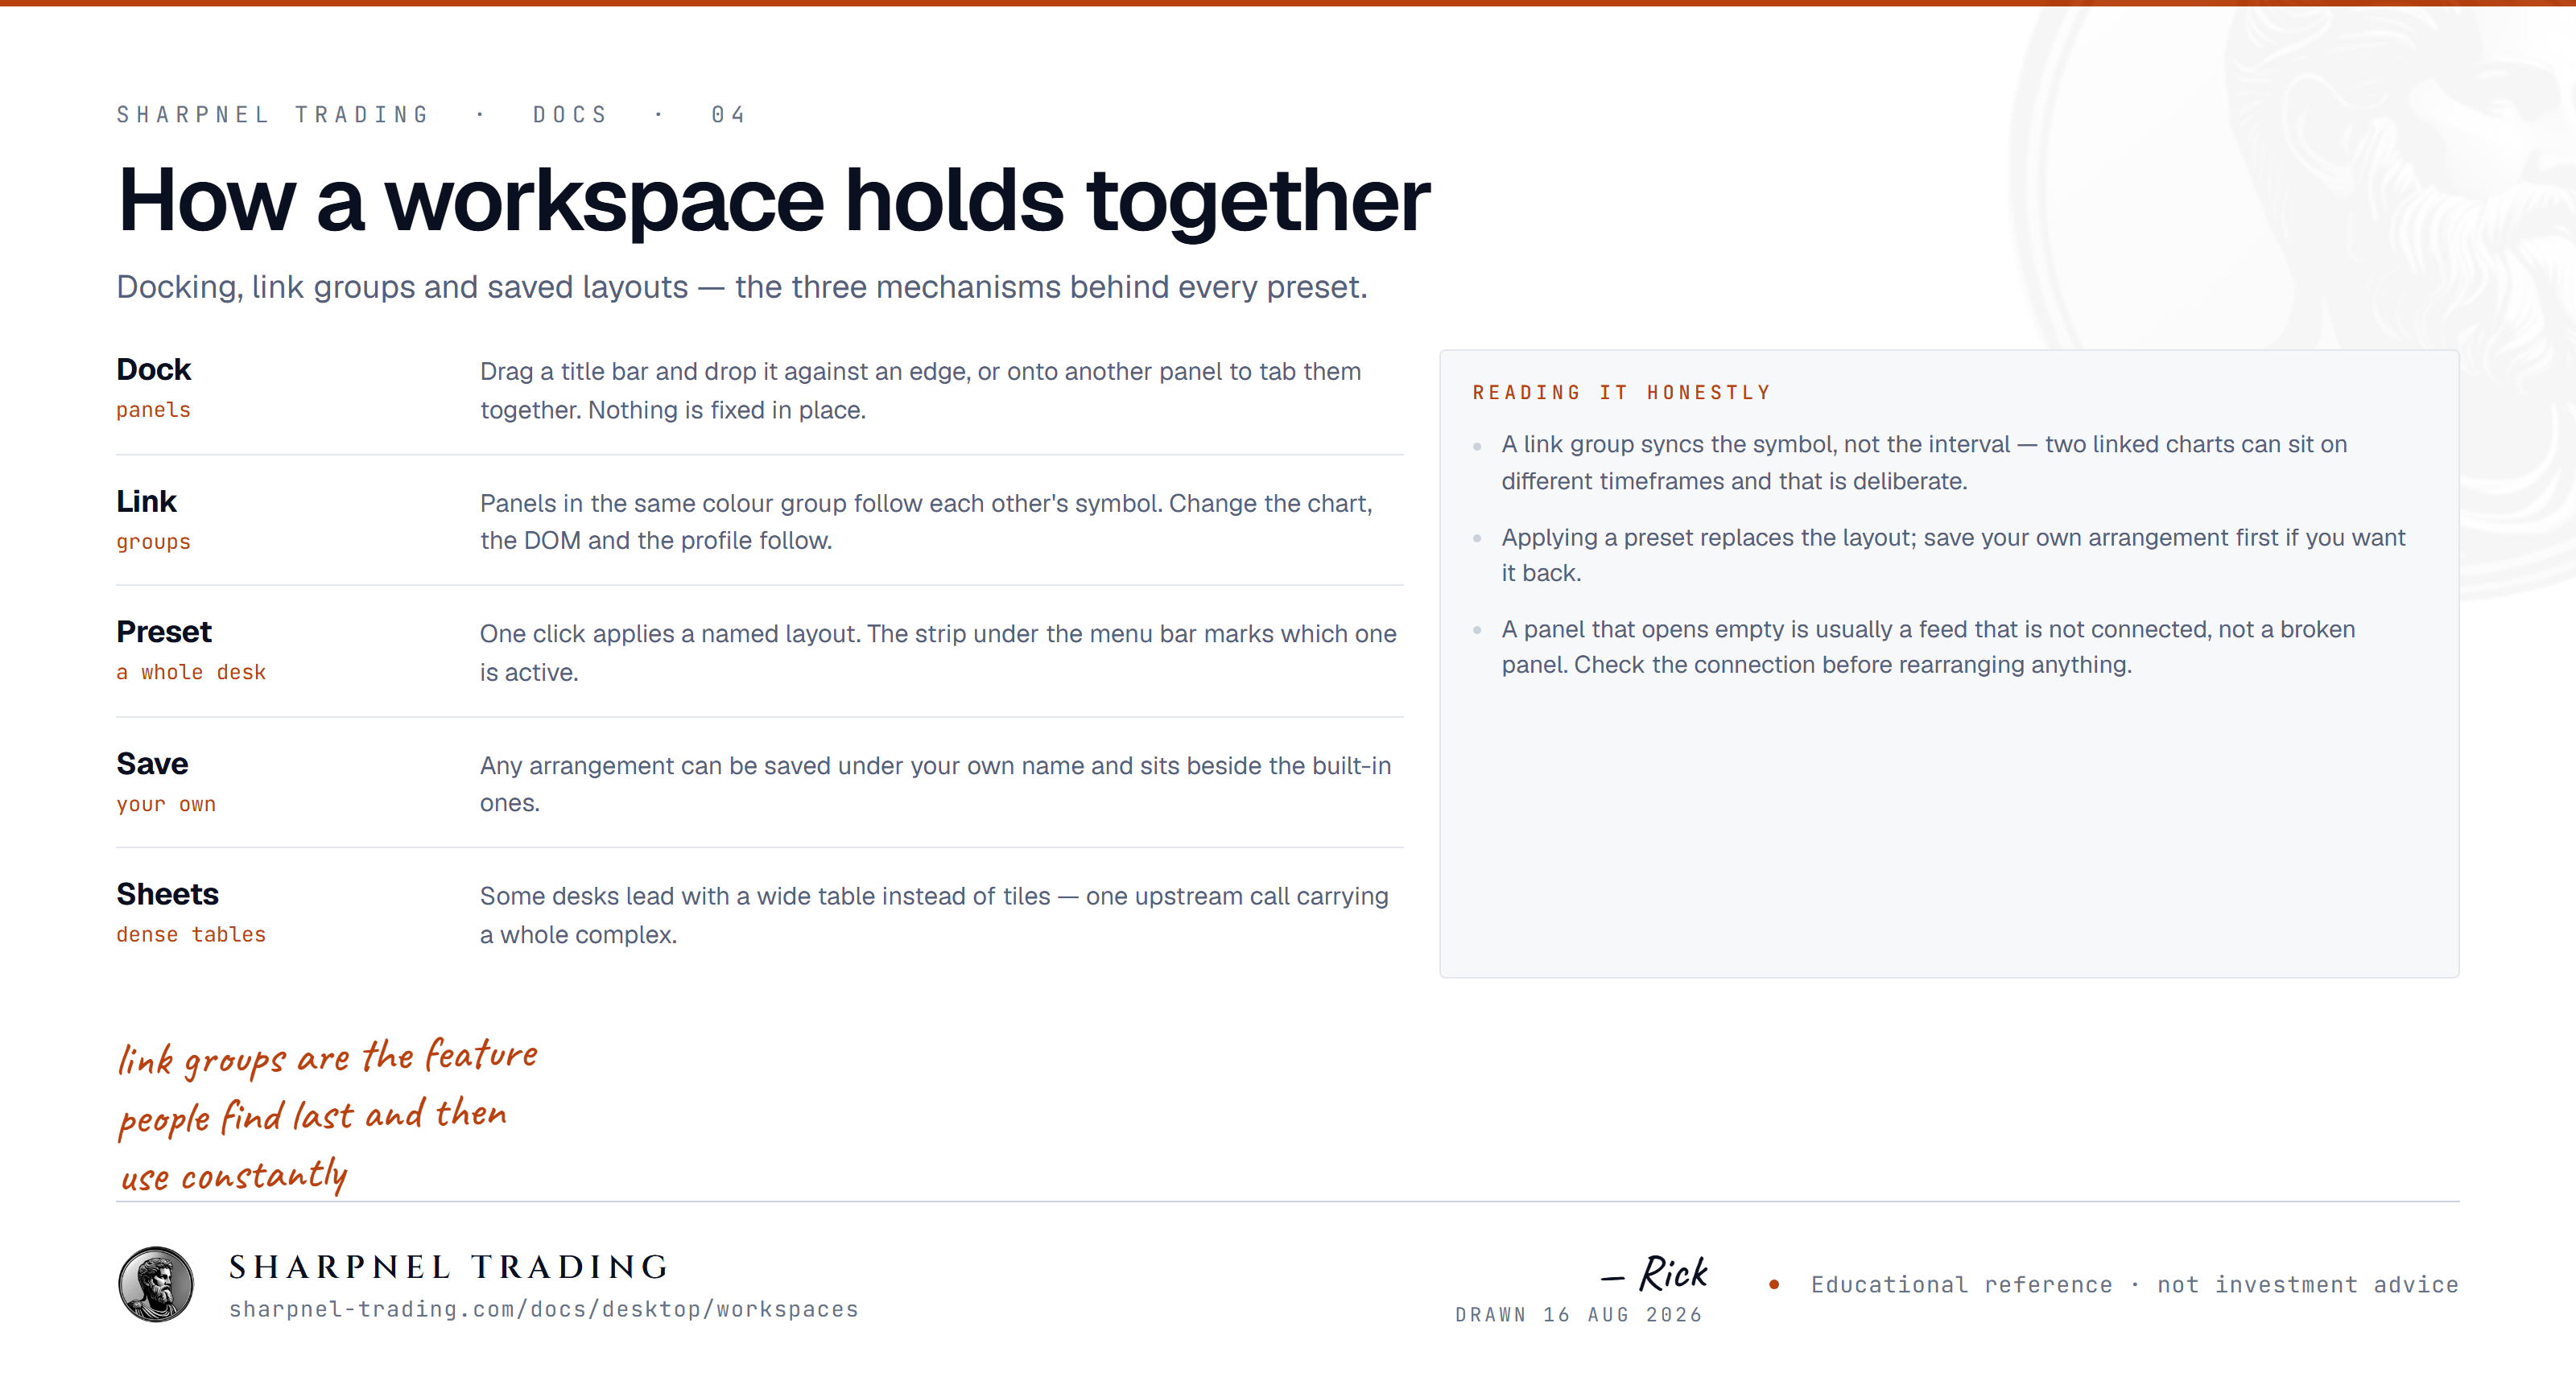
Everything in the desktop terminal is a panel — a chart, a DOM ladder, a news feed, a macro tile. Panels live in a docking workspace that you rearrange by dragging:
The active panel is highlighted so you always know where keyboard focus is, and each dock area has its own close button.
The Add Panel menu is the full catalog, grouped by workflow: Trading, Charts, Indicators, Order Flow, Options, Risk, Quant, Performance, Macro, and Workflow. The Macro group alone holds 70+ data panels, so it's split again — Rates & Curve, Liquidity & Central Banks, Growth & Inflation, Credit & Stress, Fiscal & Government, Global & FX, Equities & Breadth, Positioning & Options, Catalysts & Securities, and Crypto & Energy.
Faster than the menu: press Ctrl+P for the command palette (also under File › Command Palette…) and type the panel name — every panel in the catalog is registered there. Press Ctrl+K for symbol search.
The core order-flow surfaces also have direct shortcuts: Ctrl+Alt+D for the DOM, Ctrl+Alt+F for the Footprint, Ctrl+Alt+T for TPO.
The DOM is multi-instance. The first time you press Ctrl+Alt+D (or pick Add Panel › Order Flow › DOM V2), the DOM opens. Every press after that spawns a new, independent ladder pinned to whatever symbol is active at that moment — so you can stack ES, NQ, and CL ladders side by side, each with its own live depth subscription.
DOM · ES, DOM · NQ — and keeps its own symbol. It deliberately does not follow symbol linking, so switching symbols elsewhere never hijacks your wall.Multi-DOM preset (see below) builds a four-ladder wall in one click: ES · NQ · QQQ · SPY, side by side, full height. Re-applying the preset reuses the same four ladders instead of piling up extras.You don't have to build a layout panel by panel. The Presets menu holds dozens of pre-built desks, grouped into Trading, Macro & Rates, Research, Order Flow, and Options & Vol. One click rebuilds the whole workspace; a checkmark tracks which preset is active. A sample:
Command Center | Order flow (DOM/T&S) left, chart + world map center, sector treemap / watchlist / breadth right, wide news feed bottom. This is the desk a fresh install lands on. |
Wall of Data | Max density — nine live panels tiled 3×3: DOM, chart, time & sales, watchlist, macro, news, breadth, sectors, yields. |
Day Trader | Chart + Footprint + TPO center, DOM + time & sales right, positions + orders bottom. |
Multi-DOM | Four live depth ladders side by side — ES · NQ · QQQ · SPY — each on its own symbol. |
Options Desk | Chart + options chain center, vol term structure + vol surface left, Greeks + vol cone right. |
Global Macro | World map center, breadth + internals left, macro + yield curve right, sectors + econ calendar + FX bottom. |
Filings Radar | The regulatory-filings event wall: buyback / spin-off / bond-issuance tapes beside the distress flags — bankruptcies, restatements, going-concern. |
Ag Balance | The grain balance wall: weekly corn / soy / wheat export sales (demand) beside quarterly grain stocks (supply). |
Sovereign Debt | Government debt-to-GDP tiled across the G7 + China + EM — the sovereign-risk board. |
There are many more — rates, credit, FX, energy, labor, earnings, short-squeeze, volatility, and morning-brief desks among them — plus Minimal (a single chart) if you'd rather build your own from scratch. A preset is a starting point, not a cage: apply one, then drag, split, and float until it's yours.
What the terminal opens on: the order-flow DOM (footprint + liquidity heatmap built in) big in the CENTER; the Chart over the policy stream (central-bank speeches + regulatory wire tabbed) on the LEFT; and Correlated Markets — the traded symbol's complex (XLK/QQQ on an NQ day) plus all eleven S&P sectors sorted by day move, live quotes + relative strength + real 1m-return correlation — over the watchlist over the Gamma Stream ladder on the RIGHT, with Bank Stress tabbed behind it. Preferences ▸ General changes it, or turns it off and restores your own last layout instead.
MAX DENSITY around the order-flow DOM: the DOM big in the CENTER, Chart/T&S/Watchlist left, Breadth/Macro/News right, Sector/Yields/Internals bottom
The order-flow DOM big in the CENTER, Chart + T&S left, Sector Treemap/Watchlist/Breadth right, World Map + News bottom rail
Everything for prepping a futures name (ES/NQ/CL/GC): the instrument chart with GEX walls + volume profile as the hero, order flow (DOM + Footprint) on the LEFT, cross-market Overview + Watchlist on the RIGHT, and the macro docket (Econ Calendar + News) along the BOTTOM. Every panel follows the instrument. What Pharos opens when you ask for a forecast on a future.
Fit the whole read on a SINGLE monitor — for traders without a multi-screen wall. Chart hero with the gamma walls + volume profile drawn as overlays, the order-flow DOM (mag7 basket built in) on the RIGHT, and a compact session/VIX stats strip along the BOTTOM. Everything on one dense screen.
3-column day-trading cockpit: a Footprint chart on the LEFT, the order-flow DOM big in the CENTER with an ES 1-min chart (POC + GEX), the TPO profile, and an NQ liquidity heatmap below it, multi-symbol Overview over the Watchlist on the RIGHT. Click a panel's header symbol to re-point it.
Market-wide cockpit: Breadth + Watchlist left, hero Chart over the live SEC filings feed center, News + Corporate Actions right, and the Econ/Earnings calendars + IPO/M&A pipeline + Trading Halts along the bottom — every live event pipeline on one wall
The order-flow DOM big in the CENTER, the chart family (Chart/Footprint/TPO/MTF) left, T&S right, Positions + Orders bottom
The daily brief as a live wall: the Gamma Stream ladder (per-strike dealer positioning, walls, regime) as the hero, the chart beside it, cross-market Overview + Watchlist on the RIGHT, and the docket (Econ Calendar) + pre-market movers along the BOTTOM. The terminal-native version of the daily Sharpnel Market Brief.
The 20-chart wall: ES + NQ execution charts big on the LEFT, an 18-symbol small-multiples wall (index · metals/energy · FX · EUREX · megacaps · ETFs) tiled 6x3 on the RIGHT — every chart pinned to its own live symbol. Stays only while it is the active layout.
Positions + Orders + Account, Correlation, Risk Dashboard + Short Interest
One large chart with the Positions strip below
2x2 multi-chart grid for cross-timeframe study
Trade-the-print board: a chart hero, analyst expectations + financials left, buyback/dividend signal + insider activity right, and the earnings schedule + live filings tape + new-issue pipeline in a bottom rail
Pre-open prep board: the overnight briefing centerpiece, session clock + watchlist left, pre-market movers + breadth right, news and the econ/earnings calendars in a full-width bottom rail
A single chart — build the rest yourself
The inflation-print desk: the CPI components sheet leads with supercore/food/energy tabbed behind, realized-vs-target inflation + market breakevens left over the calendar + surprise index, the chart under the hero, and the Treasury curve over the Gamma Stream ladder right — how the print reprices rates and dealer gamma
The Fed-decision desk: the full US rates sheet leads, central-bank speeches + the regulatory wire left over the calendar, the chart under the hero, and the Treasury curve (curve spreads + effective funds rate tabbed) over the funding plumbing (SOFR/QT, net liquidity tabbed) over the Gamma Stream right
The jobs-Friday desk: the labor-market sheet leads with payrolls/unemployment/wages/JOLTS tabbed behind, weekly claims left over the calendar + surprise index, the chart under the hero, and the Treasury curve over the dollar board over the Gamma Stream right
The expiration desk: the Gamma Stream ladder is the hero (walls, regime, per-strike dealer positioning), the expiration calendar + put/call ratio left, the chart under the hero, and the vol complex right — term structure over the realized-vol cone with the forecast tabbed — for quad-witch and monthly opex
The order-flow DOM big in the CENTER (footprint + meter built in), standalone Footprint left, T&S + Order-Flow Gauge right
The signature Sharpnel cockpit: the order-flow DOM (heatmap + cumulative delta) the hero on the LEFT, a Footprint chart top-RIGHT, and the Gamma Stream ladder bottom-RIGHT — dealer gamma on the same screen as the DOM and footprint
Four live depth ladders side by side — ES · NQ · QQQ · SPY — each on its own symbol: the multi-instrument scalping wall
The DOM big in the CENTER, Chart left, T&S right, Positions + Order Entry bottom
Follow-the-big-money desk: a chart hero with the short-positioning stack, 13F ownership, activist stakes, insider trades, COT futures positioning and fund flows — click any name to chart it
Full-screen Footprint order-flow
DOM + T&S side by side
Four Gamma Stream panels in a 2x2 — ES and NQ, spot ladders on top, level history below — and any panel repoints to any book in the picker: gold, the Dow, bonds, crypto, the big single names
The Options Chain sheet leads the center (full NBBO + IV + greeks; Strategy Builder + Pin Risk tabbed) with the chart below; Vol Term over the chain-derived IV Surface left; Greeks over dealer gamma over the realized-vol cone right — implied, quoted and positioned vol on one screen
The single-name workstation: pick one underlying and read everything computed for it — the full chain (Strategy Builder + Payoff tabbed) over its chart, the IV surface over portfolio greeks with the what-if slide, and the name's OWN dealer-gamma book over the greeks dashboard. Follows the symbol: the megacaps, AMD, COIN, MSTR, NFLX and the index ETFs all carry a live chain and a gamma book
VIX term structure (the curve) as the hero over Put/Call, the chain-derived IV Surface over the realized-vol cone left, and dealer gamma over the policy stream right — implied vol beside positioned vol, with the macro-event docket one tab away
The rates & curve + CPI sheets lead with the Macro Dashboard tabbed beside them and the Yield Curve below; Central Banks + the Economic Calendar left, FX Matrix + Housing right
Physical-power + energy cockpit: the real-time Grid Price Map (NYISO + CAISO zonal LMP, client-side BYOD) as the hero, with EIA inventories, energy-futures COT positioning, a chart for the crude/gas complex, and macro context
The rates & curve sheet leads the center with the Chart tabbed beside it over the Economic Calendar; Central Bank speeches + Regulatory Wire left, Bank Stress + Yield Curve right — the macro-event & policy cockpit
The 'what's breaking' monitor: Bank Stress + Regulatory left, Vol Term Structure + Yield Curve center, Central Banks + Market Internals right
Pure rates cockpit: the Treasury curve hero (breakeven + curve-spread tabs), overnight funding plumbing left, credit-spread/CDS context right, and the auction/buyback/debt-cost supply tables along the bottom
The Fed liquidity & risk sheet leads, with the net-liquidity tide, the stress decomposition and the dealer/funding plumbing tabbed behind it; RRP + fiscal-cash drains left, repo/SOFR + swap lines + money funds right, the rates sheet + M2/bank credit along the bottom
Business-cycle board: the labor-market and CPI sheets lead with the live GDP tracker tabbed behind them, the weekly claims/activity/recession stack left, production + the business/consumer pulse right, confidence + data-surprise gauges below
Credit-stress cockpit: an IG/HY spread hero, financial-stress gauges + single-name CDS left, bank balance-sheet context right, and a loan-delinquency rail — where is credit cracking
Cross-rate grid hero flanked by currency strength + rate-differential drivers and central-bank policy + cross-border swap-line funding, with regional macro feeds along the bottom
The risk-on/risk-off board: a vol-curve hero with positioning, rates + credit left, breadth + sector + FX leadership right, and stress + recession composite gauges below — read the regime at a glance
The jobs wall: JOLTS, unemployment, payrolls, participation, wages, hours, temp employment + jobless claims — every labor-market read tiled at once
The crude complex tiled: production/exports/imports/refining supply, Cushing + inventories + demand, and natgas/gasoline/diesel + electricity prices
Where federal money flows: the contract + defense + grant award tapes over the Treasury / debt-composition / auction / debt-cost complex
The consumer sheet: retail sales beside real PCE by category, income + saving, the Fed's PCE inflation pair, vehicles + housing, household credit stress and the Michigan sentiment split — CPI components beside it
The ag sheet: weekly soybean / corn / wheat export net sales (demand) against quarterly grain stocks (supply), plus crop condition and planting/harvest progress, with a chart + Mississippi grain-barge flow
The US rates complex on one sheet: policy + the SOFR complex, bills, the whole nominal curve, real yields + breakevens, curve spreads, commercial paper and corporate/mortgage rates
CPI on one sheet, headline to the components: food, energy, shelter, core goods and services, transport, education + recreation — the full BLS breakdown
Credit & bank stress on one sheet: corporate spreads by rating, charge-offs + delinquencies by loan type, SLOOS lending standards, commercial paper and the bank balance sheet
The power & fuels sheet: US generation by fuel (coal / gas / nuclear / wind / solar / hydro), retail electricity by sector, and the fuel-price complex from Brent to the pump
The rates & curve + CPI sheets lead the center with the World Map tabbed beside them; Breadth + Internals left, Macro Dashboard + Yield Curve right, Sector Treemap + Econ Calendar + FX bottom
Geopolitical hazard + sanctions map over the risk-premium stack it feeds — financial stress, credit spreads, the vol curve and safe-haven currency flows
Maritime chokepoints + production-geography map over the trade-balance, currency and futures-positioning lens — where physical flows meet price
Refinery/LNG/fab infrastructure map over the physical-power grid, inventories, a crude/gas chart and energy-futures positioning
Financial-center index map over the cross-rate grid, rate-differential drivers, dollar-funding swap taps and central-bank policy stance
World-sessions + macro-HUD map over the risk-on/risk-off read — vol curve, credit spreads, single-name CDS, put/call and recession odds
Germany / France / Italy / Spain on one sheet — industrial production, producer prices, HICP and unemployment, every row read against the euro-area aggregate beside it
Emerging markets on one sheet: growth, inflation, current account and government debt read across China / India / Brazil / Indonesia / Mexico / Turkey / South Africa / Korea — IMF WEO
The euro complex on one sheet: the ECB policy corridor + €STR, both euro yield curves at eleven tenors each (AAA and all-governments, so the periphery premium reads off the gap), fourteen EUR crosses, and euro-area HICP
Government debt to GDP on one sheet — the G7, Spain + Korea, the big emerging markets and the euro-area aggregate, IMF WEO; the stock side of the sovereign trio, same economies row for row as the fiscal + current-account boards
ECB daily reference exchange rates — EUR vs USD / GBP / JPY / CHF / AUD / CAD majors + CNY / SEK / NOK and EM MXN / ZAR / TRY, the euro-cross board
Fiscal balance, % of GDP — deficit or surplus for the same economies as the Sovereign Debt board, row for row, IMF WEO; the flow that builds the debt stock
External balance — current account, % of GDP, for the same economies as the debt + fiscal boards, row for row; the third leg of the sovereign trio, IMF WEO
Peer-overlay view: DE / FR / IT / ES industrial production on ONE multi-line chart (legend + per-country pills + all-series hover) beside the four member-state tiles
Crypto BYOD cockpit: Chart center, Deribit options IV term structure right, multi-exchange perp funding rail bottom — streams live from your own exchange connections
Chart + News Feed + Economic Calendar + Earnings + Scanner
Signal Scanner left, Chart + News right
Penny Scanner momentum wall center, Chart + T&S left, Watchlist + DOM right — click a runner to chart it
Squeeze workspace: Short Sale Heat Map + Reg SHO (threshold/SSR) + FTD Pressure + Trading Halts, with Chart + Catalyst Feed — every clean SRO short-data feed in one wall
Stat-arb cockpit: a pairs scanner over its live spread, regime + correlation context left, cointegration + dynamic hedge ratio right, and spread/causality/regime diagnostics across the bottom
The deal + catalyst wall: going-private / tender-offer / passive-stake / late-filer filing tapes over activist 13D, IPO pipeline, filings feed + halts + drug-shortage catalysts
The EDGAR full-text event wall: buyback / spin-off / bond-issuance catalysts (L) beside the distress flags — Chapter 11, restatements, going-concern, material weakness (C+R) — every 8-K/10-K signal on one screen
Federal fiscal + government-spend wall: foreign UST holdings + corporate profits beside federal award tapes — health / homeland / NASA / transportation contracts + clinical-trial setbacks
Beyond dragging individual panels to other screens, Window › Multi-Monitor automates the whole desk:
Detach All Panels (Ctrl+Shift+F11) floats every open panel and tiles them across all connected monitors in one shot.Command Center (Multi-Monitor) puts order flow + execution on monitor 1, world map + macro context on monitor 2, and deep analytics on monitor 3; Trading Trifecta splits charts / order flow / macro across three screens; Dual: Chart + Flow is the two-monitor version. Screens you don't have fall back to your primary monitor, so they degrade gracefully on smaller setups.Pop Active Panel → Monitor 2 (one entry per detected screen) sends the focused panel to a specific monitor without any dragging.Symbol linking keeps panels in sync: click a row in a watchlist or a scanner and the linked chart, DOM, and time & sales follow. Links are organized into colored channels so one desk can run several independent groups at once.
None, Amber (the default), Green, Red, Blue, Violet, Lime, or Cyan.None unlinks a panel completely — useful for the extra DOM ladders or a reference chart you want pinned.A typical split: scalping owns the chart + DOM on monitors 1–2 (Amber), while a swing chart on monitor 3 sits on Green and never gets dragged along. Channel assignments are saved with your workspace and restored on the next launch.
The workspace autosaves every 30 seconds and again on exit — window geometry, the dock layout, which panels are open, chart studies, and link-group assignments. Relaunch the terminal and your desk comes back exactly as you left it. Ctrl+S (Window › Save) forces a save any time.
The Window menu also gives you:
Save Layout As… / Load Layout / Manage Layouts… — keep multiple named layouts (a morning desk, an FOMC desk, a scalping wall) and switch between them without rebuilding.Export Workspace to JSON… / Import Workspace from JSON… — a portable file copy of your workspace, for backups or moving between machines. Load from file… (Ctrl+O) loads a saved workspace file directly.Reset to defaults — wipe the layout and start clean if you've docked yourself into a corner.