EWMA of actual-vs-consensus economic releases.
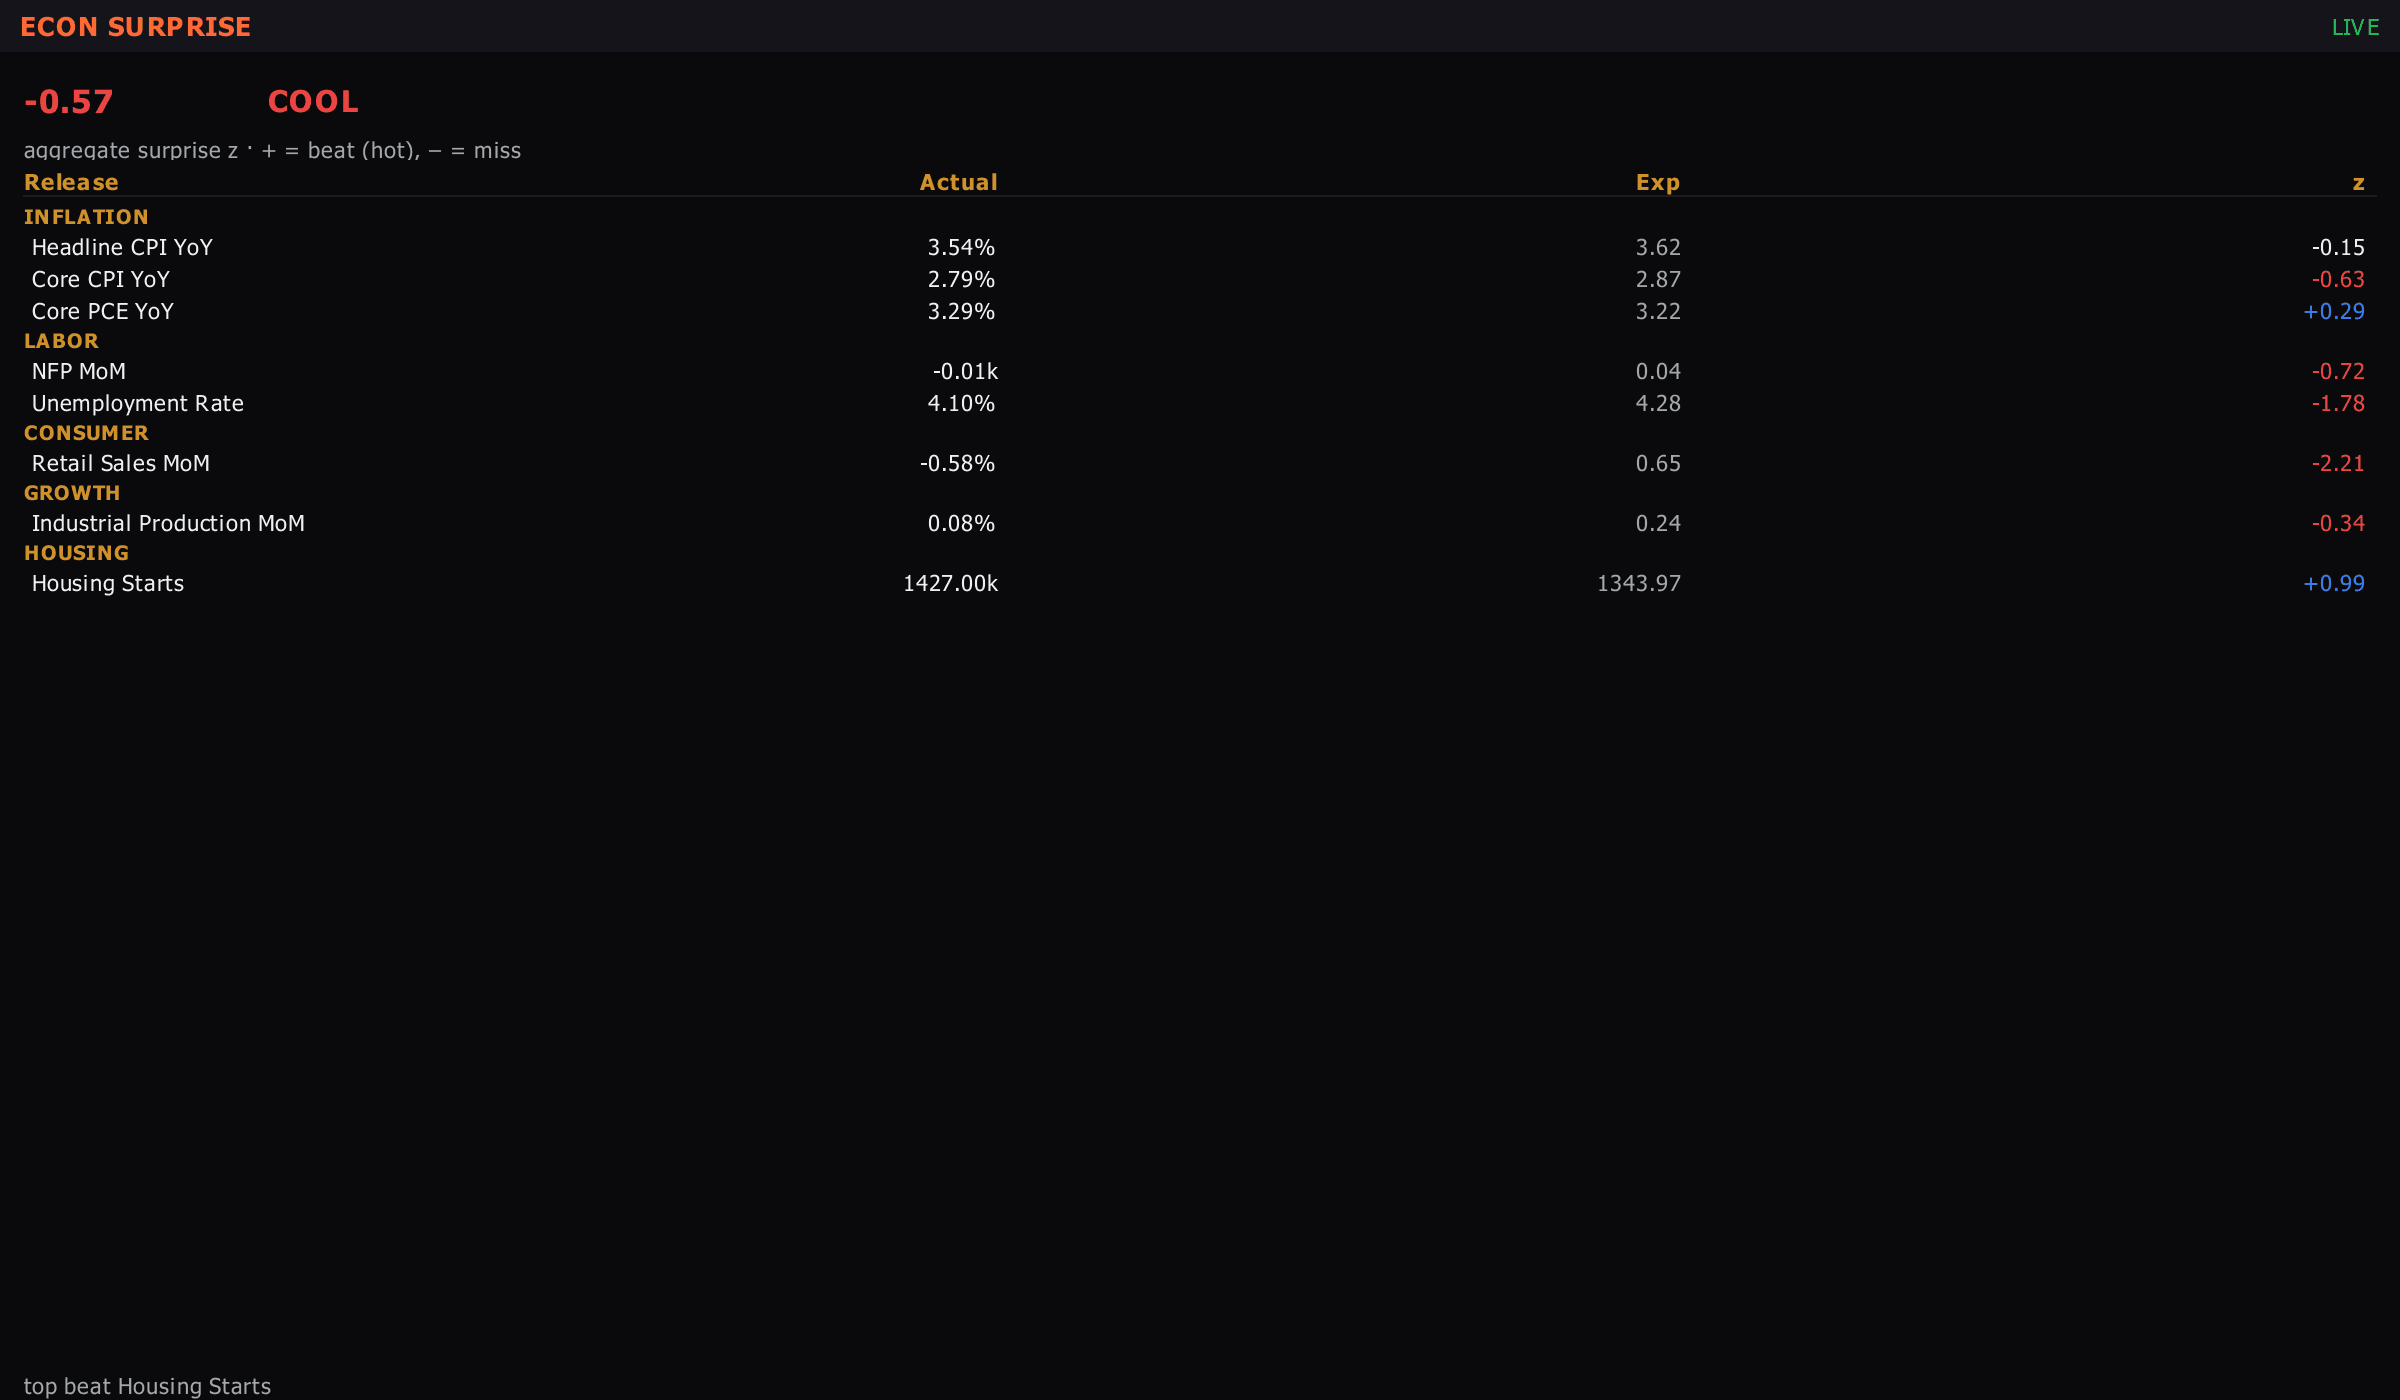
An EWMA of actual-versus-consensus across releases — whether the data is beating or missing what was expected, rather than whether it is good.
Reach for itWhen you want the direction of the macro tape without reading twenty prints.
“The economic surprise panel tracks whether data is beating or missing consensus, rising when the data runs hotter than expected.”
EWMA of actual-vs-consensus economic releases.
Open itAdd Panel ▸ Macro ▸ Growth & Inflation ▸ Economic Surprise Index (actual vs expected)
Y axis = surprise index (positive = data beating consensus, negative = missing). EWMA smooths individual prints into a regime read. Above zero + rising = data is hot, hawkish repricing risk for rates.
Below the headline: per-category contributions (growth / inflation / employment / trade). The category dragging or pushing tells you WHICH part of the macro narrative is moving — growth surprises ≠ inflation surprises in their impact.
Right rail: chronological list of recent releases with actual vs consensus + standardised z-score. Big z-score (|z| > 2) = outlier print; expect immediate rate / FX / equity re-pricing.
Surprise index up + FFIP repricing toward more hikes = consistent macro trade (front-end sell-off). Surprise index up + FFIP unmoved = market disagreeing with the data; sticky narrative may break.
