The print tape.
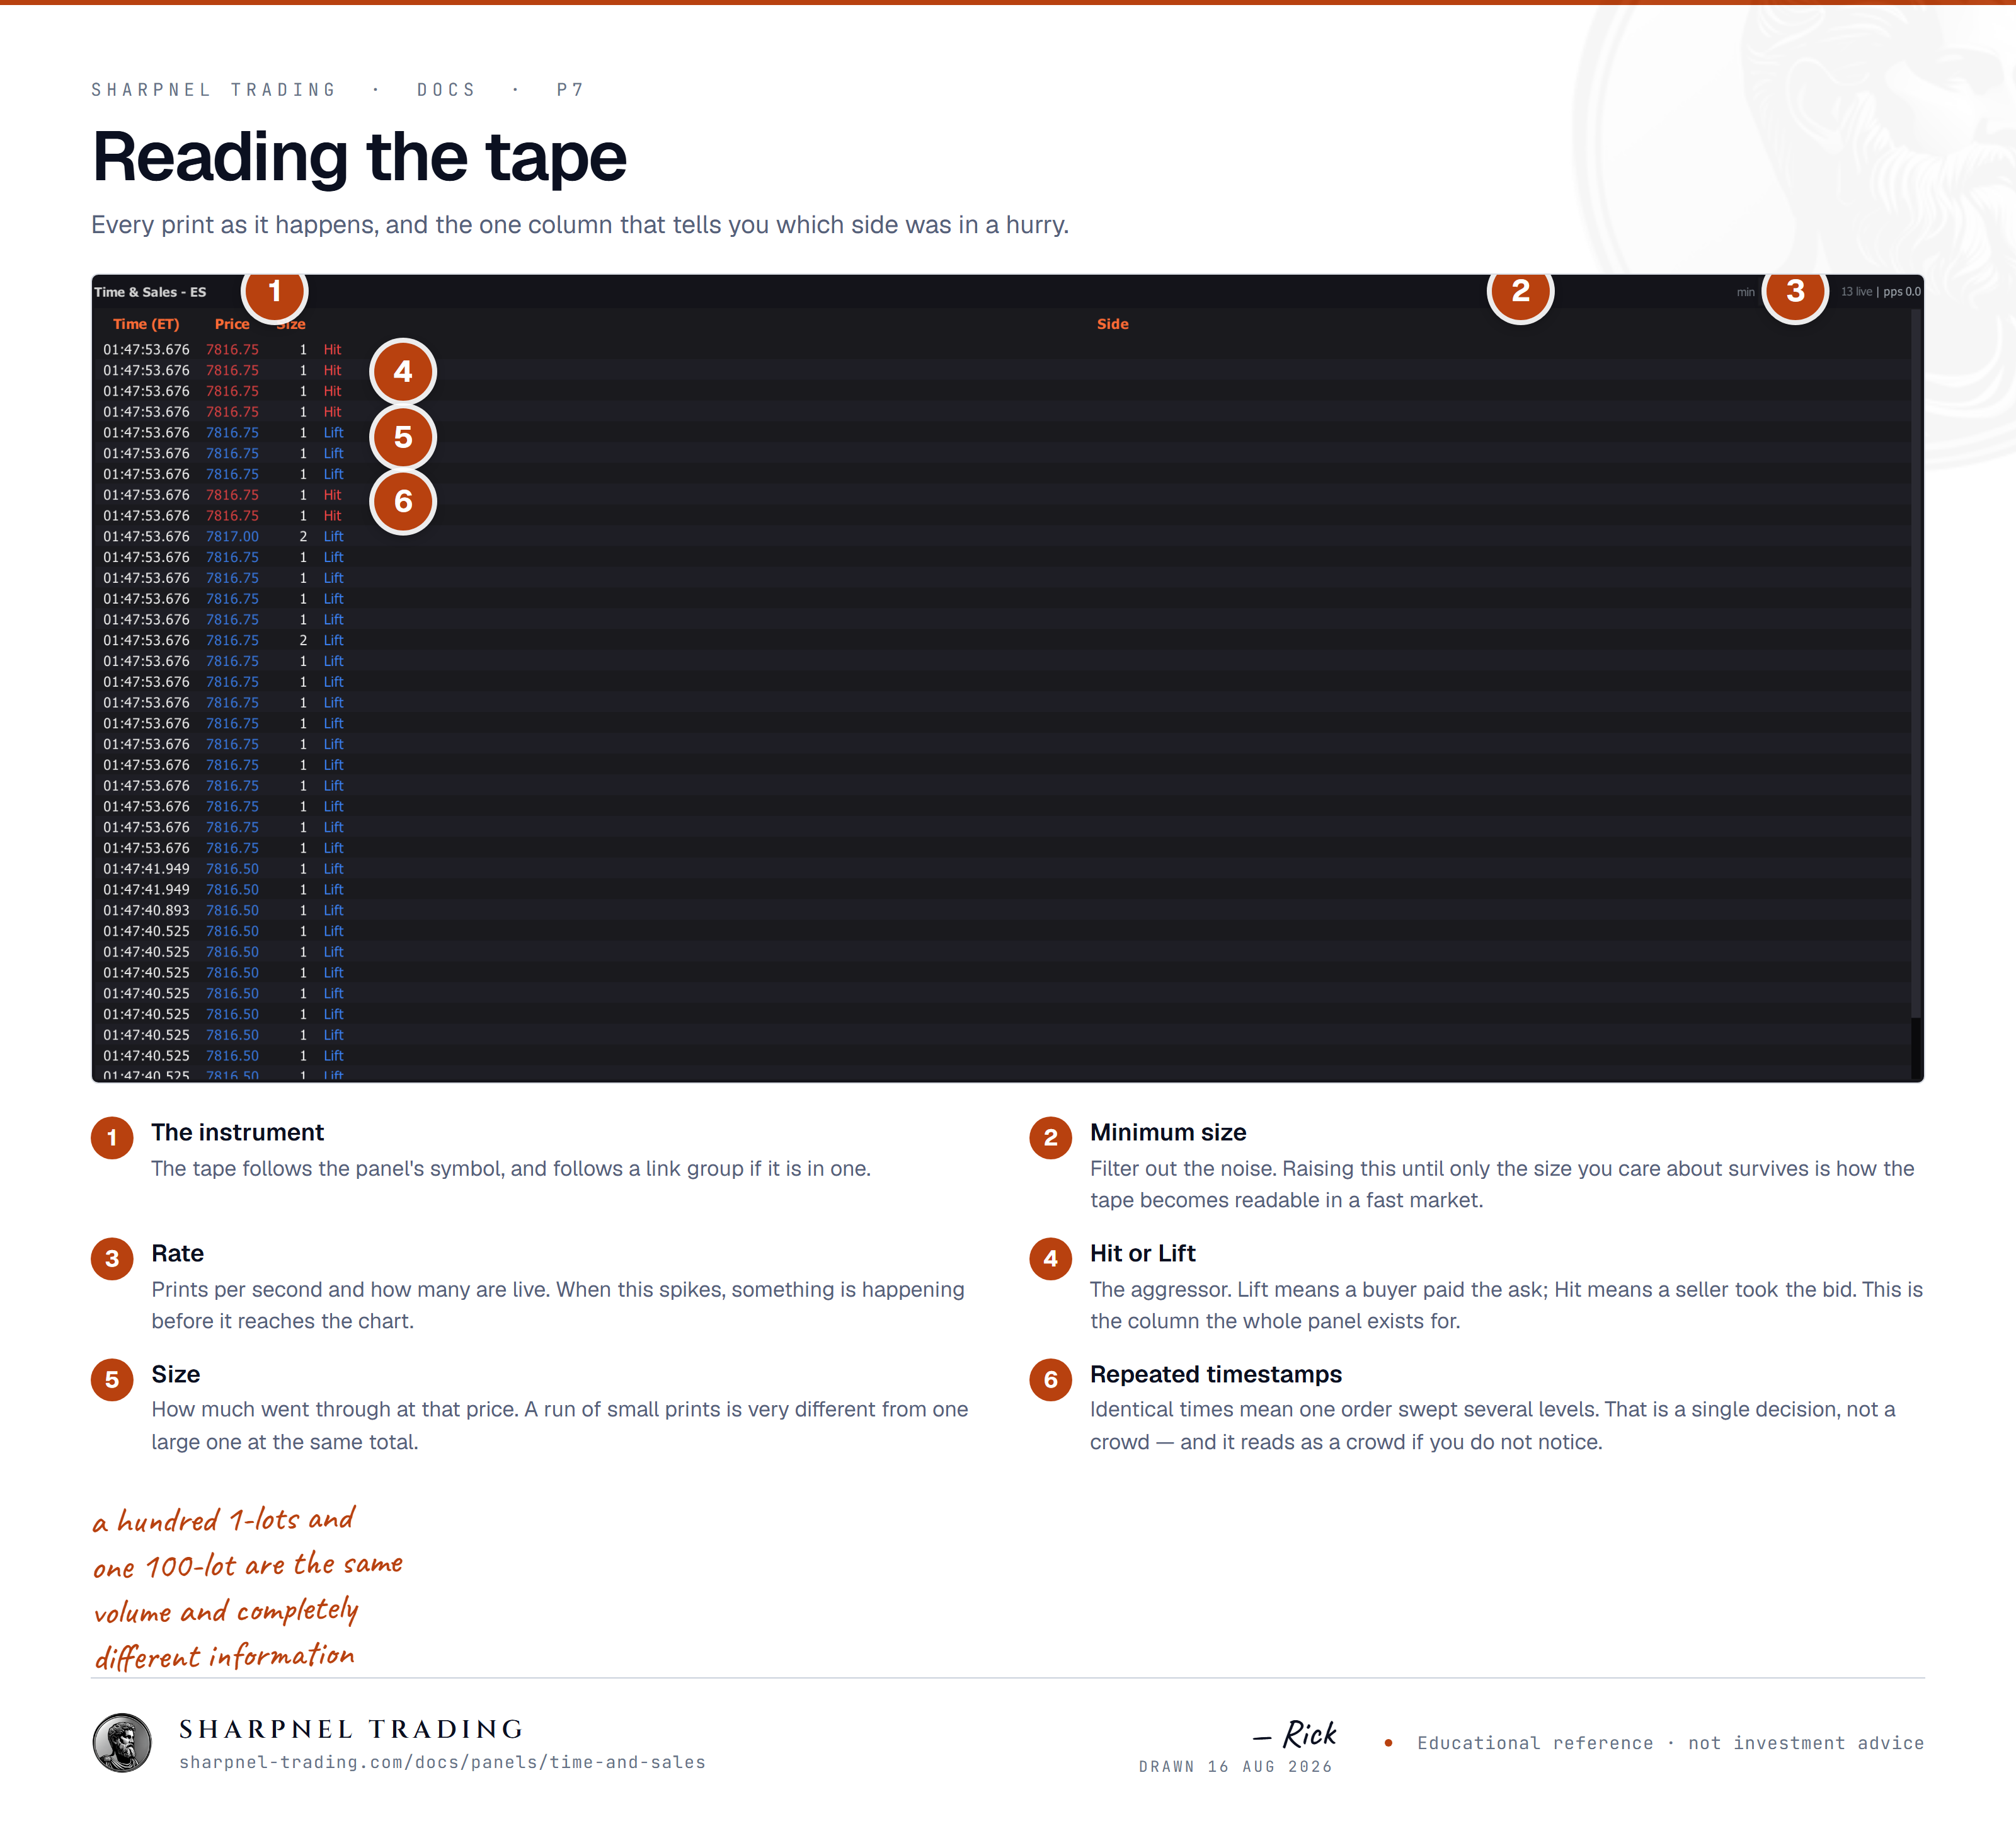
The print tape — every trade, classified, in order. The DOM shows intent; this shows what happened. When the two disagree, this one is right.
Reach for itAny time size appears on the ladder and you need to know whether it traded or vanished.
“Time and sales, the tape, is the running list of executed trades with their price, size and time.”
The print tape. Read aggressor side + size tier.
Open itAdd Panel ▸ Order Flow ▸ Time & Sales
Time, price, size, side. Newest at the top, oldest scrolls off the bottom. Scroll wheel pauses the feed at your scroll position so you can study a cluster without it sliding away.
Color tells you who initiated. Cyan rows mean the buyer reached up and took offers. Magenta means a seller hit standing bids. Sustained one-side prints = directional aggression.
Row brightness scales with print size. Whale-tier prints flash with a 500ms quadratic ease-out so a 2000-lot landing is visible across the whole panel even if you weren't watching that row.
Watch the DOM ladder while the tape prints. If prints stack on one side but the resting size on that side doesn't shrink, you're seeing absorption — someone is reloading the same book size every time a print clears.
