Candles, indicators, drawings. The primary surface.
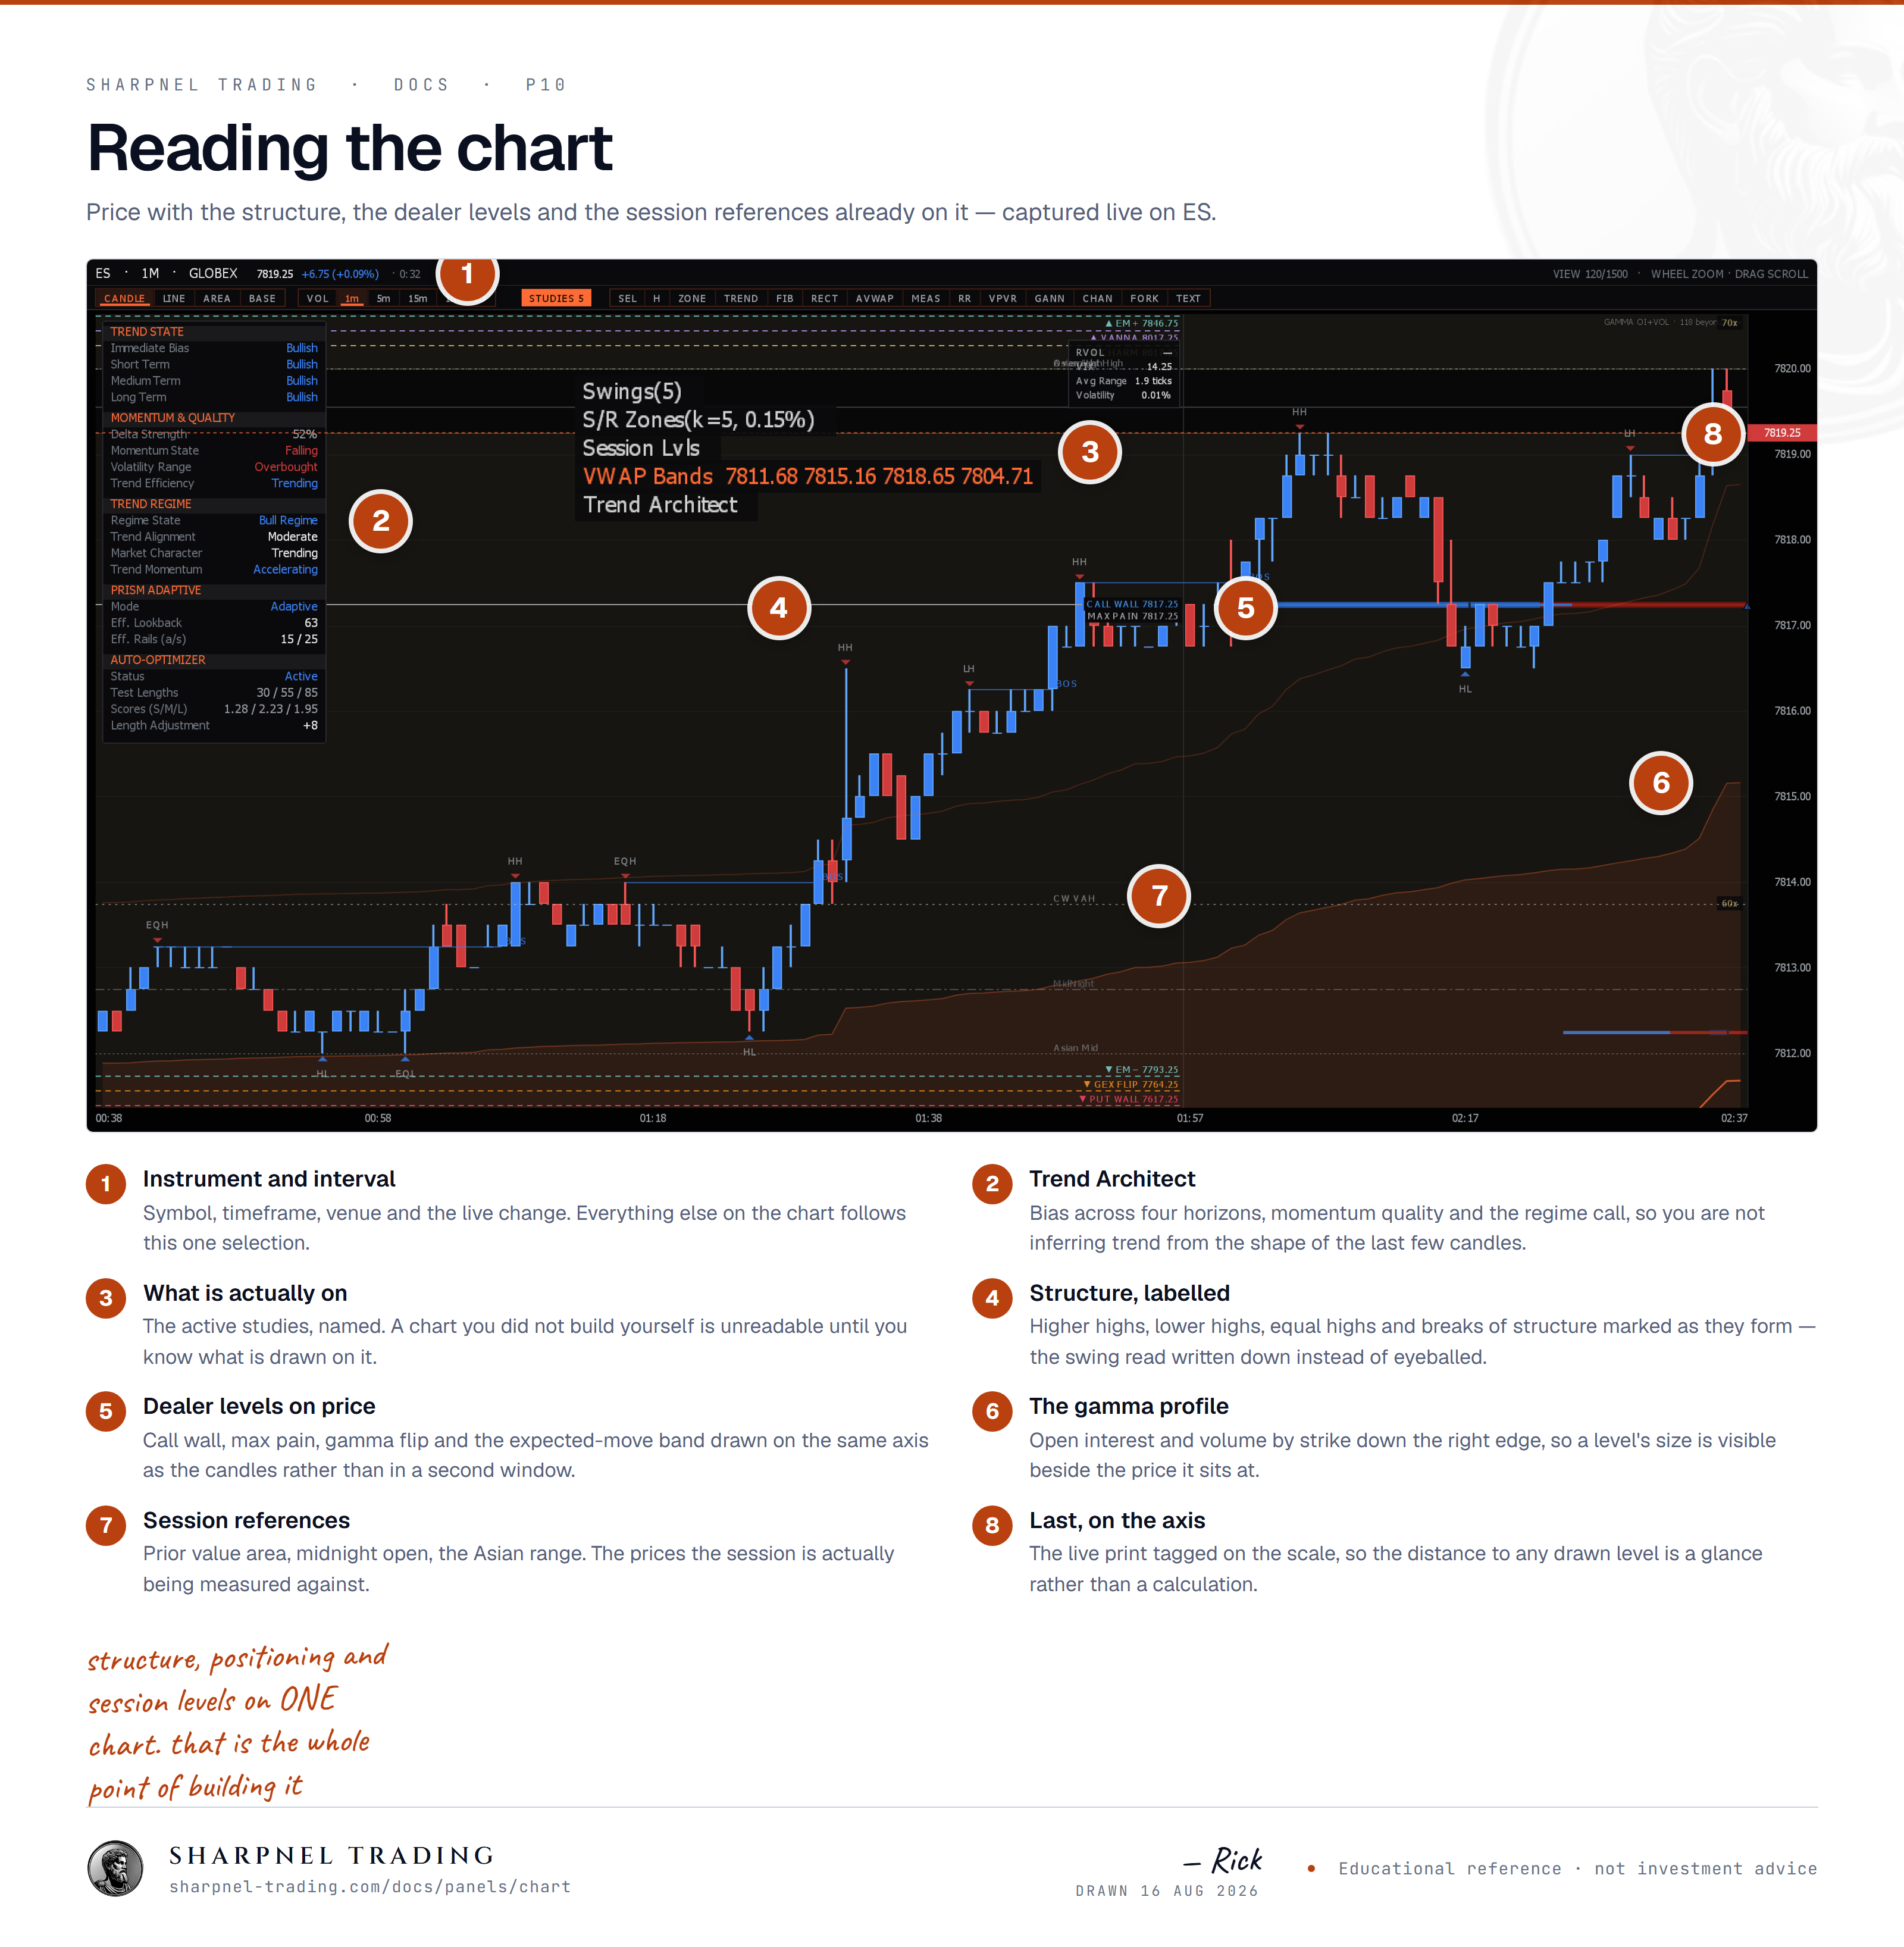
“The chart is the main price panel, plotting price over time as candles, where studies, drawings and order flow overlay.”
Price over time, opinionated. The chart ships with one carefully-tuned visual register — Heikin-Ashi candles, climax tinting on exhaustion bars, real-tick footprint cluster dots, and persistent horizontal lines for the levels that move the market. No 200 indicator toggles. The intent is that you open a chart and immediately see what matters.
The chart renders on a native, GPU-accelerated engine — no browser, no per-frame server round-trip. It stays smooth under 10k+ bars and new ticks reach the screen within a millisecond of data arrival.
Five steps to confidence.
Press Ctrl+P and type @ followed by a ticker — @AAPL, @ES, @NVDA — to snap the chart and everything linked to it onto that security. Panels follow through their link group, so you set the symbol once and the desk moves together.
The timeframe control in the toolbar drives the main chart, and Chart ▸ Timeframe carries the same list per chart. The chart re-aggregates immediately — step down through a few and watch the regime change as resolution drops.
Scroll wheel = zoom (price + time axes track together). Shift-scroll = horizontal pan. Double-click = snap back to the latest bar and re-engage auto-scroll. R resets the view to defaults.
Add Panel ▸ Order Flow ▸ DOM, or Ctrl+Alt+D. Bid and ask depth, stacked imbalance, structure labels (VWAP / IBH / IBL / POC), pulled-liquidity strips and recent aggressor delta, with the footprint and liquidity heatmap built in. Click a price to submit against the sim account.
Once the workspace looks the way you want it, type `save my-desk` to persist the layout. Reload it any time later with `layout my-desk`. Type `help workflows` for guided sequences answering specific trader questions.
Ctrl+P, then # and the panel name. The bare symbol ES retargets whichever chart is focused.NQ CHART.Default candle style is Heikin-Ashi — averaged OHLC that smooths intraday noise and surfaces the directional bias of a run more readably than raw candles. The neutral palette is dark slate-purple; trending bars stay grey by default.
Bars that meet the climax classifier's criteria pick up one of six tinted body colors. The classifier reads RSI(30) Wilders on cumulative delta plus aggressor intensity per bar. Six tiers across two sides:
Climax tinting is part of the candle render itself, not an overlay. There is no toggle — this is what a candle looks like in Sharpnel.
Futures symbols (ES, NQ, MES, MNQ, YM, RTY, CL, GC, etc.) render as N-contract volume bars by default — each bar covers exactly N contracts of cumulative size regardless of wall-clock duration. ES uses N = 1500, NQ uses N = 500, others use 500 as a sensible default.
Volume bars produce uniform-energy bars: a swing top with heavy volume yields 5-8 consecutive bars in quick succession, which makes the climax classifier's output cluster visually at the swing instead of appearing as isolated marks. Equity symbols still render as time bars (5-minute default).
Small filled circles overlaid on individual bars where the per-tick footprint shows a real volume concentration at a specific price level inside the bar. Cyan for buy-aggressor-dominated clusters; pink for seller-aggressor-dominated.
Source data: the per-(bar, price-level) aggressor split is computed server-side from the raw trades stream, then attached to each bar in the chart payload. Cluster dots fire on real volume — not a synthetic distribution across the bar's high-low range.
Lines drawn across the full chart width that persist as you pan and zoom. Each line carries a small label at its right edge.
For futures, the chart defaults to per-symbol volume bars. For equities, time bars at 5-minute resolution. Resolution can be changed via the panel's prompt strip; the chart refetches and rebuilds.
Hover anywhere on the chart — the crosshair reads price, time, and OHLCV at that bar. Climax tier for the bar appears in the upper-left chrome strip when the cursor sits on a tinted bar.
The chart ships with the visual register above — and that's intentionally the whole list. No 200-indicator catalog, no user-toggleable MA / RSI / Bollinger overlays, no candle-style switcher. Every layer earns its place by reading the same order-flow signals the rest of the terminal uses (climax tints, cluster dots, gamma anchors). The intent is one consistent view that I can read at a glance instead of a blank canvas I have to configure every session.
Drawing tools, custom indicators, and the multi-style switcher live on the legacy chart, which is being retired in phases. If you need those right now, the legacy surface is still available via the workspace menu.
