The three standard reads
Signal-line crossovers
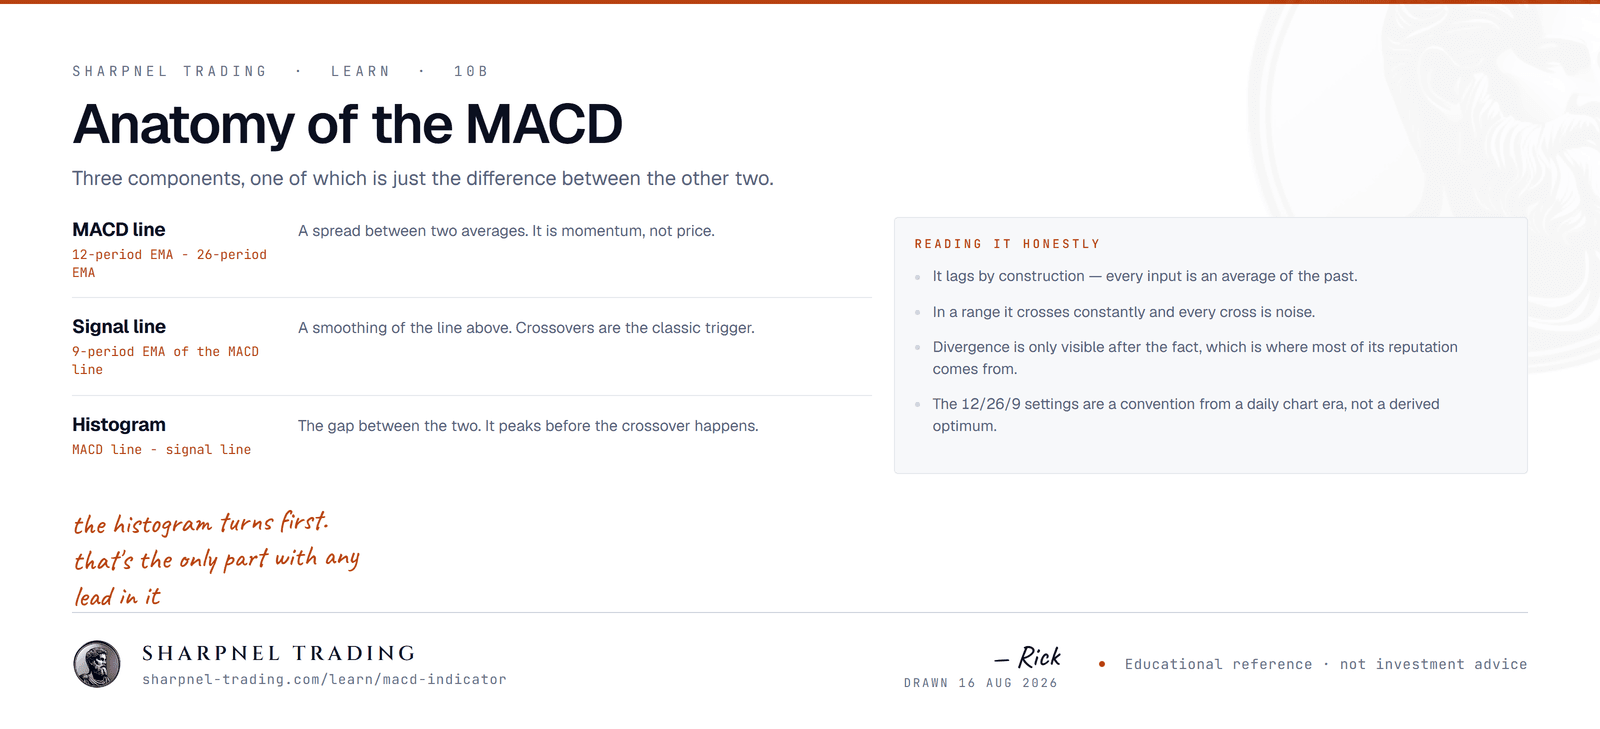
MACD crossing above its signal line is the textbook long trigger; crossing below, the short. In a trending market the crossover keeps you positioned with the move for most of its length. The losing environment is the range: sideways, the two lines braid around each other and each cross fires near the worst price of the rotation, with commissions plus slippage compounding the churn. A crossover system's equity curve is a bet on how often the instrument trends, and most instruments spend more time rotating than trending.
Zero-line crosses
The MACD line crossing zero marks the 12 EMA overtaking the 26 — a slower, sturdier confirmation that trend direction changed. Its cost is entry quality: by the time the spread flips sign, a large share of the move has already printed, and in a broad rotation the zero line gets recrossed repeatedly with no follow-through, delivering late entries at poor prices in both directions.
Histogram inflections
The histogram shrinking toward zero shows MACD converging on its own signal — deceleration visible before any cross completes. This is the earliest read the indicator offers and the least reliable; on fast timeframes the histogram flips bar to bar. Acting on every contraction produces the highest trade count of the three reads with the thinnest per-signal edge, because most contractions resolve as pauses inside the move rather than turns against it.
Divergence, read honestly
Bearish divergence: price prints a higher high while the MACD line or histogram peak prints a lower high. Bullish divergence is the mirror image. The certified content is narrow — the second push reached a new extreme with less spread between the fast and slow averages. The move decelerated. Nothing in the arithmetic says it will reverse.
The failure mode lives in strong trends, which decelerate constantly without ending. Pullbacks grow shallower and new extremes get ground out instead of launched, while the indicator stamps divergence after divergence onto a move that keeps going. Serial divergence is a signature of a durable trend more often than a topping pattern. A trader fading each one takes a string of counter-trend entries; the losses are individually small but collectively steady, and the eventual winner rarely repays the sequence. That is the honest ledger: divergence loses most exactly when it appears most abundant.
Divergence earns weight only with corroboration from outside the indicator:
- price is interacting with a level that existed before the divergence did, and
- the tape shows the aggressor side working harder for shrinking progress (next section).
Settings myths
A commonly repeated account traces the 12/26/9 defaults to Gerald Appel's work in the late 1970s, with 12 and 26 approximating two weeks and one month under the six-day trading weeks of an earlier market era. Whatever the true origin, the numbers are conventions, not constants of nature.
The persistent myth is that a best MACD setting for day trading exists. Every parameter choice is a point on one tradeoff curve: shorter periods cut lag and admit noise; longer periods filter noise and add lag. Halving the periods makes the indicator fire earlier and be wrong more often. No setting escapes the curve, because the input — past closes — is identical at every speed.
Backtest-optimized settings are the same myth with more decimals. An optimizer will always crown some parameter set for a given instrument and window; the crown tends to fail out-of-sample because it was fitted to that window's particular mix of trend and rotation.
A third myth is stacking several MACDs at different speeds and calling their agreement confluence. They are one calculation sampled at different rates on identical inputs; their agreement is close to guaranteed and carries almost no independent information.
Founder note: I keep the stock 12/26/9 on the single chart where I run MACD at all. Stable parameters mean my eye learns one instrument's normal histogram amplitude — re-optimizing would reset that learning every month for no measurable gain.
What volume and order flow change
MACD consumes closing prices and nothing else. It registers that price moved; it cannot see how much traded to move it or which side initiated the trades. Two identical crossovers can sit on opposite tapes: one printed on expanding volume with initiative buying lifting offers bar after bar, the other printed in a thin overnight session where a few hundred contracts walked price the same distance. The indicator treats them as the same event. Order flow is how you tell them apart.
The highest-value pairing is divergence plus delta. A bearish MACD divergence says the second push decelerated; cumulative delta says whether aggressive buyers were still committing into it. When delta surges to a strong new high while price barely improves, the divergence has a mechanism underneath it — heavy buying absorbed by passive selling, effort without result. When the push was thin and delta flat, the "divergence" may be nothing more than the arithmetic echo of a small pullback two swings ago.
Flow context filters signals; it does not repeal the underlying problem. A decelerating push into absorption still resolves higher whenever the passive seller pulls their size. Adding the tape shrinks the set of divergences worth acting on, and the survivors still lose when larger resting interest steps aside.
Before acting on any MACD signal
- Classify the regime first. Crossover reads are trend tools; deceleration reads belong near the edges of a rotation. Applying either in the wrong regime is the largest single source of MACD losses.
- State what the lag hides. The signal is centered several bars in the past — check whether price has already traveled somewhere that makes the trade's location unacceptable.
- Demand participation evidence. Volume expansion or delta agreement turns a derived-price signal into a corroborated one; their absence is information too.
- Write the invalidation before entry. A MACD signal has no built-in stop — the lines can stay crossed while price moves against you indefinitely.
- Keep a tally by regime. A month of logged signals shows where the indicator pays its way on your instrument and where it quietly bleeds.
The indicator reports that two averages converged; the tape reports who made that happen. The second question is the tradable one.