levels
Today's call wall and put wall on each contract are right below, free, no account, nothing to accept. The email is the part you can't get by remembering to come back here: tomorrow's levels land in your inbox before the open, with the regime around them and how the last session's levels actually scored against the tape.
ES — call wall 7,854 · put wall 7,554 · NQ — call wall 31,241 · put wall 29,741
as of Oct 3, 2:50 AM ET · OI-derived dealer-gamma estimates, recomputed intraday · informational, not advice
Pharos · October 2, 2026 · NQ · 10:04 ET
“The Nasdaq: the call wall 31235. the Nasdaq crossed above the call wall.”
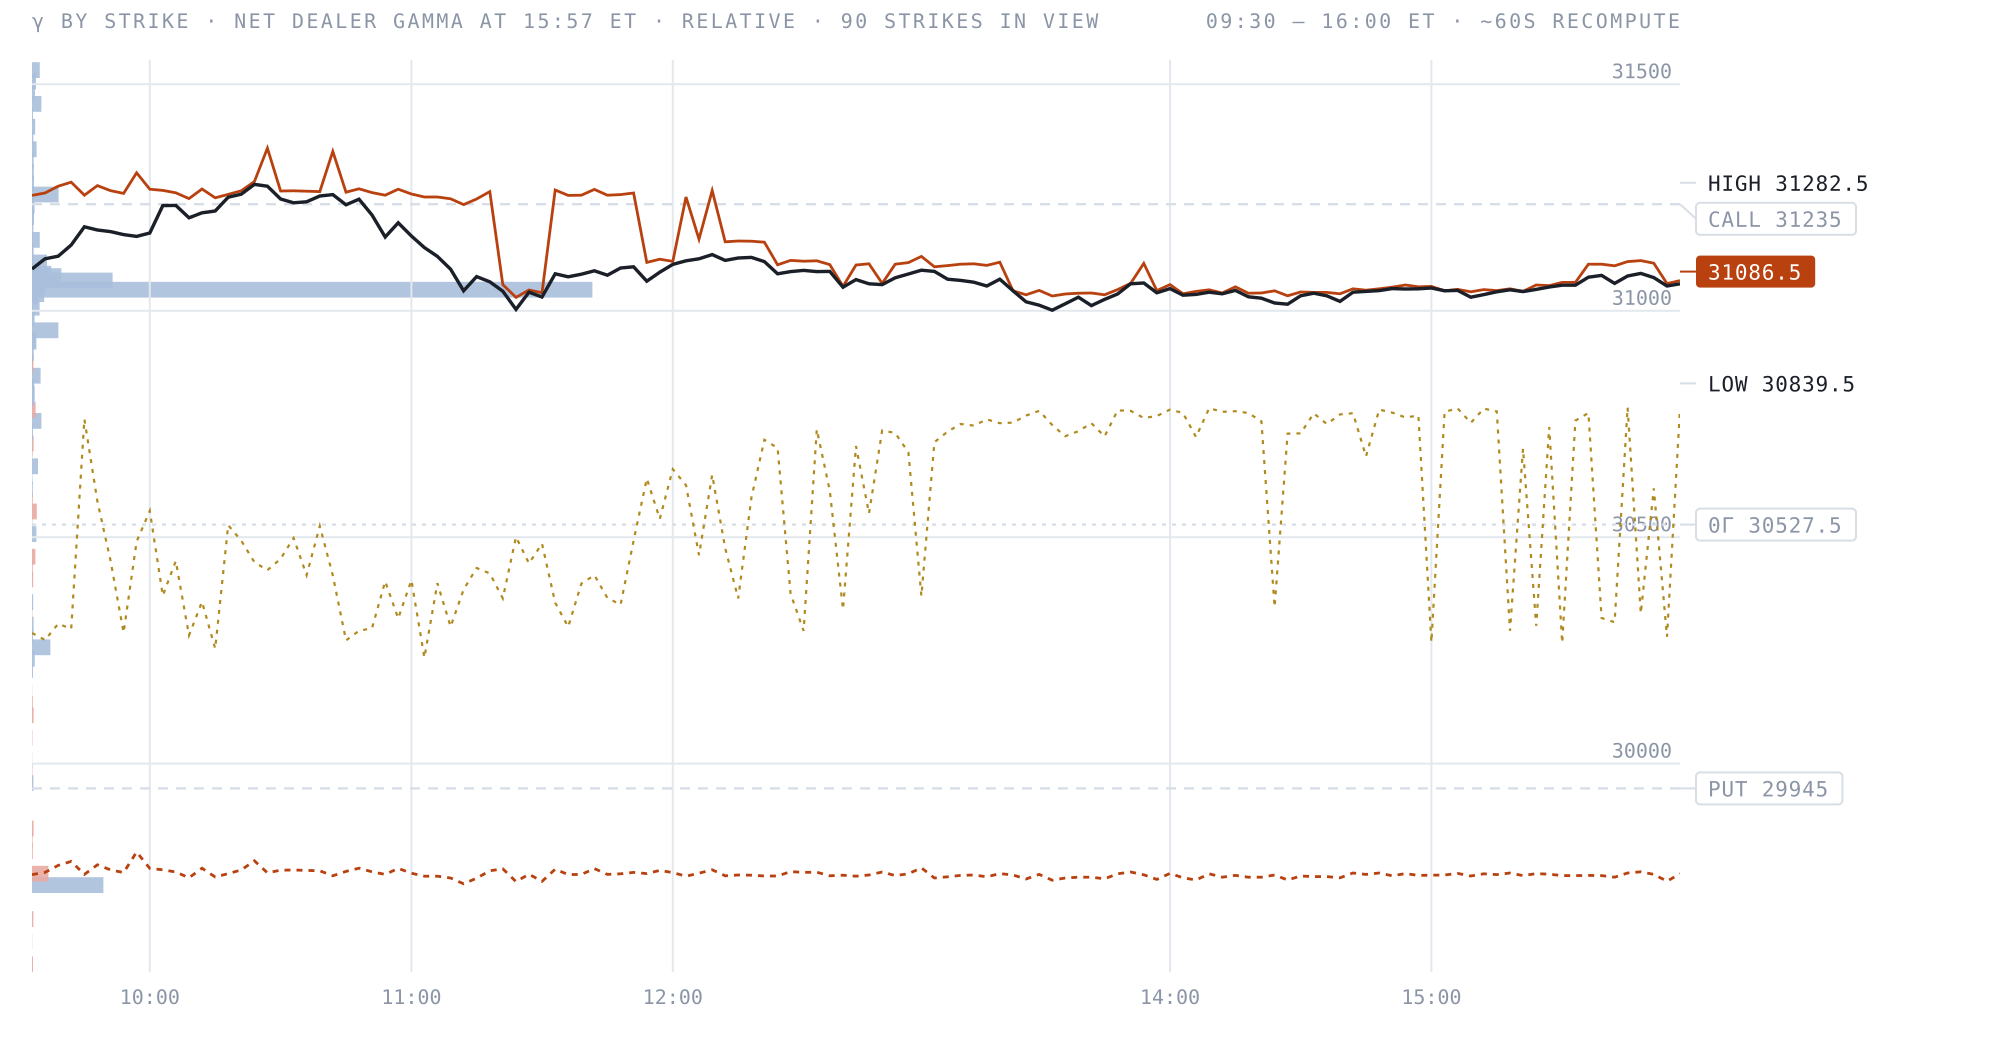
That’s today, and only while you have this page open. Put your email in above and tomorrow’s arrive before the open, with the regime around them and the previous session’s scored against the real high and low.
The close read, from the gamma engine
This is a real end-of-session read from my own OI-derived gamma engine — where the walls sat when the bell went, published once a day and never retouched. What it can't show you is the session itself: in the terminal these levels rebuild about every minute on your own chart, next to the DOM, the footprint and the tape, with the zero-gamma line and the full strike profile. The walls move all day. This page shows you where they ended up; Pro shows you while it's happening.
OI-derived dealer-gamma estimate · published once after the close here, rebuilt ~60s in the terminal · informational, not advice
$125/mo — or $94/mo billed annually
What you are reading here is free and stays free. Pro is the live one: these walls and the full strike profile rebuilt about every minute while the session runs, on the same chart as the DOM, the footprint and the tape — and drawn inside your own charting software too.
Both screens
The walls are computed once and rendered identically whether you read them in the Sharpnel terminal or inside Sierra Chart, NinjaTrader 8, Quantower or MotiveWave, all on one key. Most traders keep the desktop open for the read — the ladder, the footprint and the tape beside the walls — and keep the levels on the chart they already place orders from.
 Sierra ChartInstall guide
 NinjaTrader 8Install guide
 QuantowerInstall guide
 MotiveWaveInstall guide
 ATASInstall guide
 BookmapInstall guide
Covers ES, MES, NQ and MNQ. The MotiveWave study is Java, so it runs on macOS too.
Before you use them
0DTE is now the majority of SPX option volume. The strikes dealers are hedging get rewritten through the session, so a wall you read premarket has moved by late morning. Treat the morning number as where the session starts, not where it ends.
You read 7,589, alt-tab to your platform, and eyeball roughly where that sits. The level never touches the thing you actually press buttons on, which is where the decision gets made.
Dealer-positioning services publish levels and go quiet on the days price cut straight through them. I score mine against the recorded tape every afternoon and the broken ones stay on the page. Read the record before you trust the read.
On this page, free
ES and NQ each get their own call wall and put wall, computed from the option complex tracking their own index and scaled to the futures contract on the live basis. The rest of the board reads the same way, each book from its own listed options: gold and silver, the Dow and the Russell, bonds, bitcoin and ethereum, and the big single names. Posted before the cash open.
Every session's levels are scored against the real high, low and close off the recorded tape. The running percentage further down this page is that record, not a claim — the days it failed are in it.
If you would rather not leave your platform, the same walls draw inside Sierra Chart, NinjaTrader 8, Quantower and MotiveWave from one API key — recomputed through the session rather than held at the morning print. That is included with Pro. The MotiveWave study is Java, so it also runs on macOS.
| The job | The morning read | On your chart |
|---|---|---|
| When it is true | At the open, and decreasingly after that | Recomputed about every 60 seconds while the session runs |
| What you see | The headline walls and the flip | The full per-strike ladder behind them |
| Where you read it | This page, or your inbox, then your memory | Drawn on the chart you already trade, redrawing as the surface moves |
| What it costs | Nothing, permanently. No card | $125/mo — and the DOM ladder, footprint, TPO and tape come with it |
Same numbers in both — this table is only about the levels. Pro is the whole terminal; the redraw is one of the things inside it, and on the days the surface moves early it is the one you notice first.
Free. One trader, the levels and flow I'm watching. Unsubscribe anytime.
Every trading day at 4:15 PM ET the morning levels are scored against the session's real high, low and close from the recorded tape. Every day lands here — the ones that held and the ones that broke.
ES call wall / put wall held
last 21 sessions
NQ call wall / put wall held
last 20 sessions
RTY call wall / put wall held
last 16 sessions
YM call wall / put wall held
last 16 sessions
| Session | ES | NQ |
|---|---|---|
| Oct 2 | both held | call broke |
| Oct 1 | put broke | call broke |
| Sep 30 | both held | call broke |
| Sep 29 | both held | both held |
| Sep 28 | both held | both held |
| Sep 25 | both held | both held |
A wall held if the session never closed through the level I published that morning. Every graded session appears — the ones that held and the ones that broke. I don't publish a combined accuracy score: the gamma-flip leg of it isn't graded yet, and averaging an ungraded leg in would make the number say something I can't stand behind. Full data + the exact grading rules: /data/scorecard. Days without a same-day morning snapshot are skipped, never estimated.
Everything above is free and stays free — today’s walls, the flip, and every level I’ve published graded against the close with the misses left in.
The terminal is where those levels sit on the chart while you’re trading it, rebuilt through the session instead of frozen at 08:30, next to the ladder and the tape. If you run a funded account you already send about a month of that to an evaluation. You know your own number.