all in one trading terminal
An all-in-one trading terminal replaces what most order-flow traders rent: a gamma-data service, an order-flow platform, a charting app and whatever holds the journal. Four logins, four bills, and a workflow scattered across windows that do not talk to each other. Sharpnel puts the GEX walls, the DOM ladder, the footprint, the TPO profile, the tape, the chart, the options workspace and the journal in one native desktop program for Windows and macOS, with a voice that reads the desk to you, for $125 a month or $1,125 for the year paid once.
The problem
The typical order-flow stack costs $300 to $500 a month across four separate tools: a dealer-gamma service, an order-flow platform, a charting subscription and an options or journal tool. Four logins, four invoices, four update cycles, and you still alt-tab between all of them.
Your gamma levels live in one window; the DOM and the tape you actually trade off live in another. You read a number, switch windows and eyeball where it lands. The level never sits on the order flow.
Four separate apps means four things that can lag or crash at the worst moment: a CPI print, an FOMC release. Reassembling the workspace mid-move is how the trade window closes on you.
What Sharpnel does
The GEX walls, the DOM ladder, the footprint, the reconstructed tape, the TPO profile, the chart, the options workspace and the journal run in one workspace on one symbol bus. Dealer levels sit on the order flow you are already reading; no alt-tab, no eyeballing.
The whole terminal is $125 a month, or $1,125 for the year paid once. Real-time, full-depth order-flow analytics on the major futures are included with Pro; you still pay your own broker and exchange market-data fees. The free Explorer tier runs on 15-minute delayed data with no card and no time limit.
Pharos tells you what is moving your market, one sentence at a time and in ten languages: the third push into the call wall that has not gone through, bids outweighing offers, CPI sixty seconds away. She says what the data shows and never what to do.
Studies for Sierra Chart, NinjaTrader 8, Quantower, ATAS, MotiveWave and Bookmap draw the same walls inside the platform you already run, with one key from your account, and the terminal runs beside it. Consolidation does not have to mean leaving the layouts you know.
One futures trader builds Sharpnel and trades with it every day, not a VC-backed team shipping a roadmap. When a panel is wrong, I feel it on my own P&L first.
| The job | The typical stack (4 tools) | Sharpnel (1 terminal) |
|---|---|---|
| GEX / dealer-gamma levels | A separate gamma-data subscription, read in its own dashboard or a morning PDF | Call wall, put wall and gamma flip drawn on the chart, recomputed about every 60 seconds |
| Depth-of-market ladder | A separate order-flow platform, often a runtime on top of Windows | A deep, native DOM ladder with the Pull/Stack column |
| Footprint and profile | The same platform or another paid add-on | Footprint V2 in five modes plus TPO / Market Profile, built in |
| Time and sales | Yet another window to watch | Reconstructed tape with cumulative delta, on the same chart |
| Charting | A separate charting app or subscription | Native charts in the same workspace, or the walls drawn into your own platform by a study |
| Monthly cost | Roughly $300 to $500 a month across four tools* | $125 a month, one bill, plus your own broker and exchange data fees |
| Who builds it | Teams who do not trade for a living | One futures trader who uses it daily |
*Illustrative of a common four-tool setup; your exact tools and costs vary. Sharpnel is software, not a broker: it never sees your broker credentials and never custodies funds, and you pay your own broker and exchange market-data fees.
ES and NQ as captured at 08:30 ET, every trading day, and after the close whether they held. Free, one mail a day, unsubscribe anytime.
Pharos · September 24, 2026 · NQ · 09:30 ET
“The Nasdaq: the call wall 30527.25. the Nasdaq crossed above the call wall.”
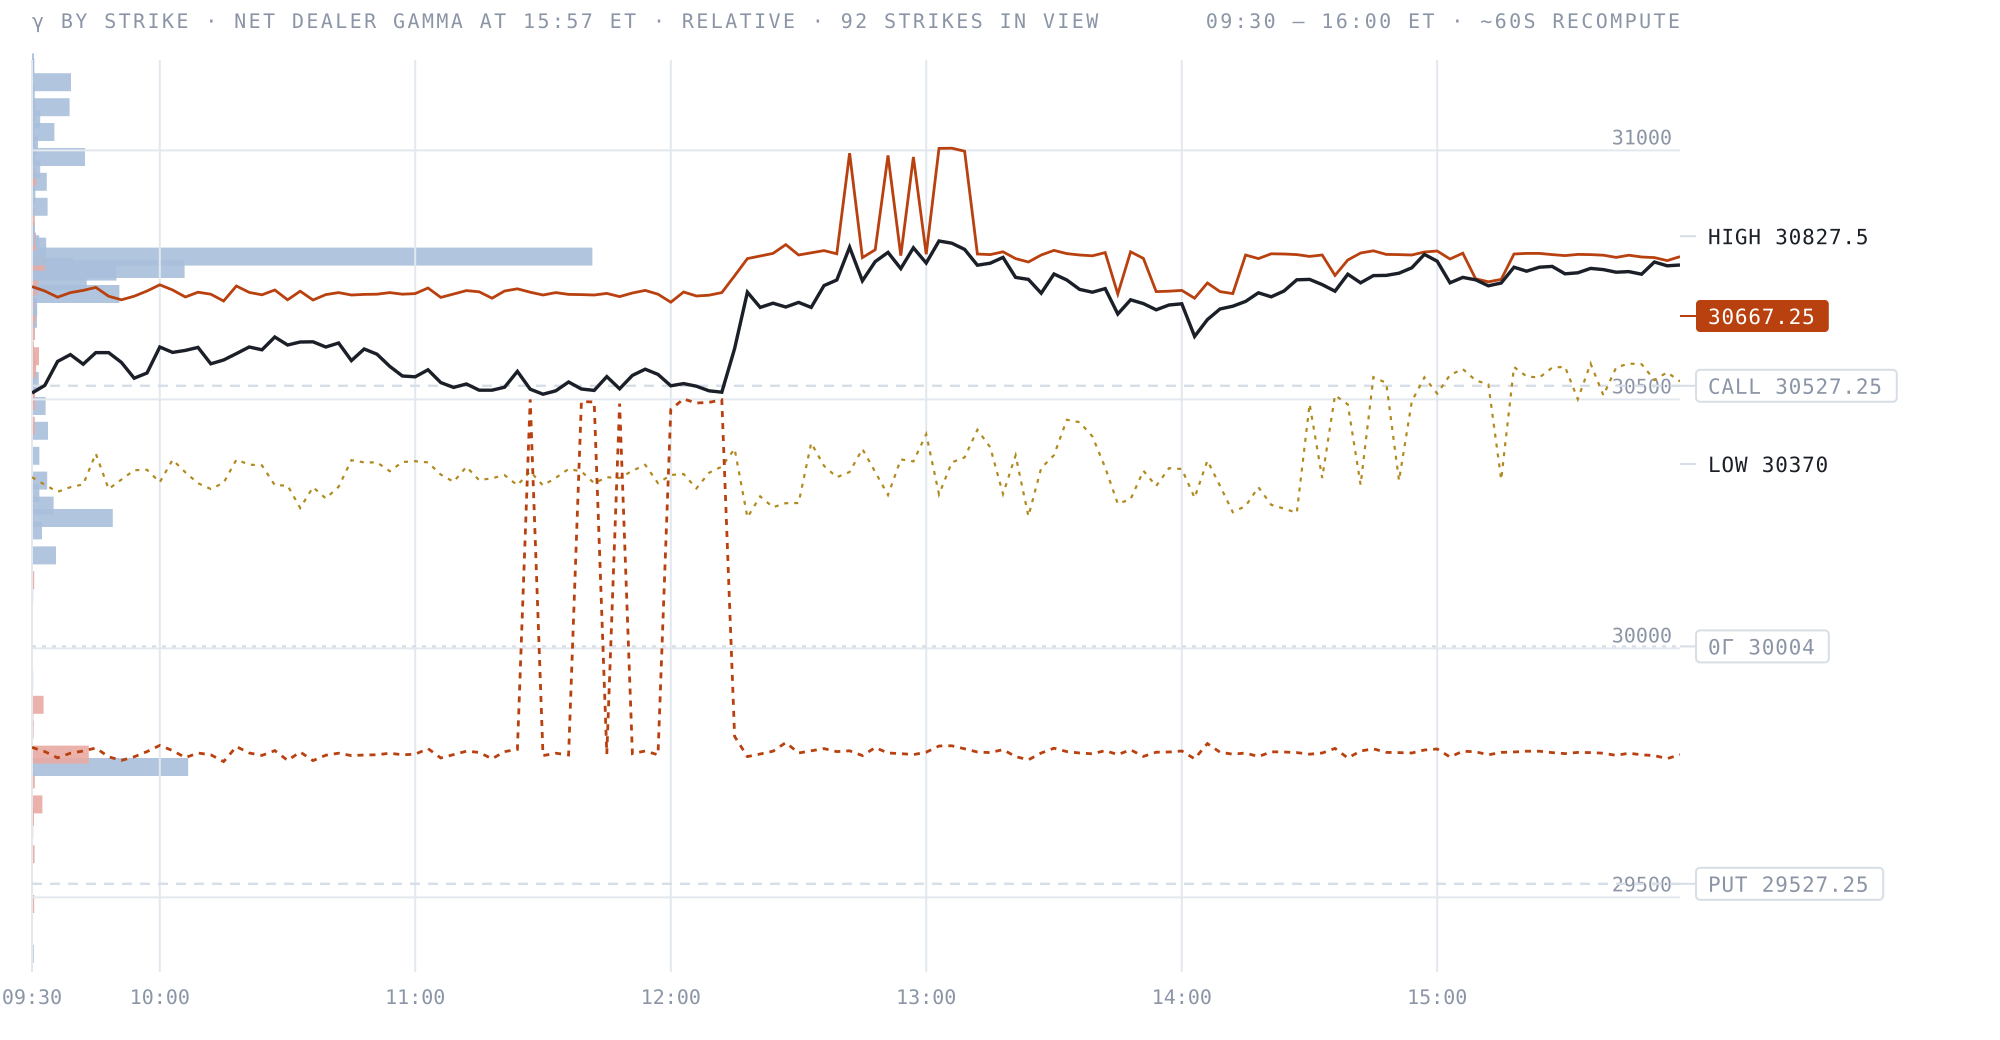
The close read, from the gamma engine
This is a real end-of-session read from my own OI-derived gamma engine — where the walls sat when the bell went, published once a day and never retouched. What it can't show you is the session itself: in the terminal these levels rebuild about every minute on your own chart, next to the DOM, the footprint and the tape, with the zero-gamma line and the full strike profile. The walls move all day. This page shows you where they ended up; Pro shows you while it's happening.
OI-derived dealer-gamma estimate · published once after the close here, rebuilt ~60s in the terminal · informational, not advice
$125/mo — or $94/mo billed annually
What you are reading here is free and stays free. Pro is the live one: these walls and the full strike profile rebuilt about every minute while the session runs, on the same chart as the DOM, the footprint and the tape — and drawn inside your own charting software too.
