gex
Call walls, put walls, and the gamma flip — drawn on the same chart as the DOM ladder, the footprint, and the tape. Recomputed intraday as 0DTE flow rebuilds the surface, not frozen in an 8am PDF. One window, not a separate dashboard. A native desktop terminal for Windows and macOS.
The problem
A morning GEX report is stale by lunch because 0DTE flow — now the majority of SPX option volume — rebuilds the gamma surface through the session. The 8am PDF is a museum exhibit by 11am, and it was never on the chart you trade.
Most GEX tools are read-only dashboards. You read a level in one window, then alt-tab to your DOM and chart in another and eyeball where it lands. The level never sits on the order flow you're reading.
Dedicated dealer-positioning services charge around $250/mo for real-time GEX by itself — no DOM, no footprint, no tape. You still pay for the rest of the stack separately.
What Sharpnel does
Sharpnel draws nine dealer-gamma level types directly on the price chart: call wall, put wall, gamma flip, max pain, expected move, high-gamma zones, vanna, charm, and the 0DTE percentage — next to the DOM ladder and the footprint.
The levels recompute about every 60 seconds: Black-Scholes gamma on live implied volatility, resummed through the session as the surface rebuilds — so the walls you trade are the walls that are there now, not the ones from the open.
The whole point: dealer levels sit on the DOM, footprint, and tape you're already reading. When price approaches a call wall, you see the absorption on the ladder at the same moment.
| The job | A GEX dashboard / 8am PDF | Sharpnel |
|---|---|---|
| Where the levels live | In a separate dashboard or a morning PDF | Drawn on the chart, next to your DOM, footprint, and tape |
| How often they update | Once in the morning — stale by lunch as 0DTE rebuilds the surface | Recomputed intraday on live implied volatility |
| What you do with them | Read a number, alt-tab to your chart, eyeball where it lands | Watch price approach the wall and the absorption on the ladder at the same moment |
| Cost for the GEX alone | ~$90–$300/mo for the dealer-positioning service by itself | Included in $125/mo with the DOM, footprint, tape, and options |
Pricing is illustrative of common dealer-positioning services; your exact tools and costs vary. You pay your own broker/exchange market-data fees.
Related concepts
ES and NQ as captured at 08:30 ET, every trading day, and after the close whether they held. Free, one mail a day, unsubscribe anytime.
Pharos · September 24, 2026 · NQ · 09:30 ET
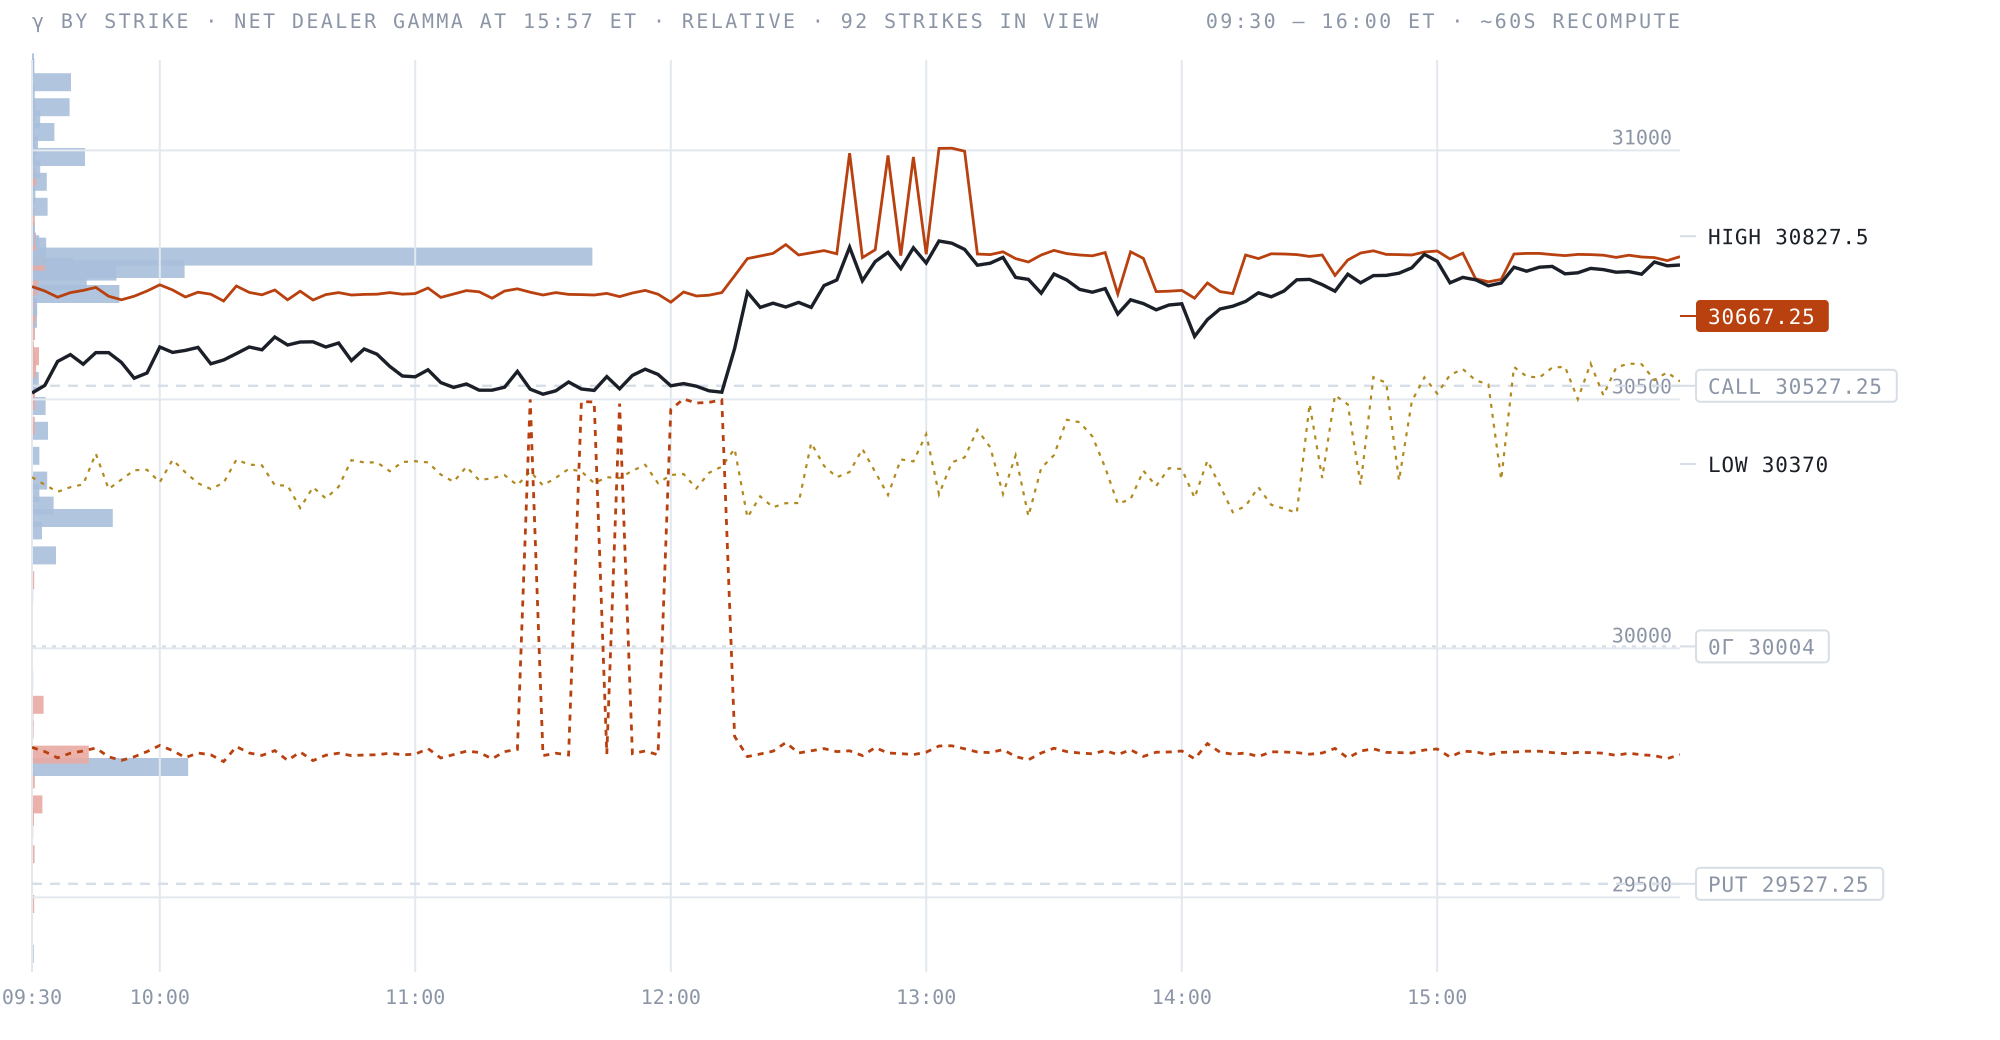
“The Nasdaq: the call wall 30527.25. the Nasdaq crossed above the call wall.”
The close read, from the gamma engine
This is a real end-of-session read from my own OI-derived gamma engine — where the walls sat when the bell went, published once a day and never retouched. What it can't show you is the session itself: in the terminal these levels rebuild about every minute on your own chart, next to the DOM, the footprint and the tape, with the zero-gamma line and the full strike profile. The walls move all day. This page shows you where they ended up; Pro shows you while it's happening.
OI-derived dealer-gamma estimate · published once after the close here, rebuilt ~60s in the terminal · informational, not advice
$125/mo — or $94/mo billed annually
What you are reading here is free and stays free. Pro is the live one: these walls and the full strike profile rebuilt about every minute while the session runs, on the same chart as the DOM, the footprint and the tape — and drawn inside your own charting software too.
