GEX dealer-gamma levels — call wall, put wall, gamma flip and more — drawn on the same chart as the DOM and footprint. Read where dealers defend.
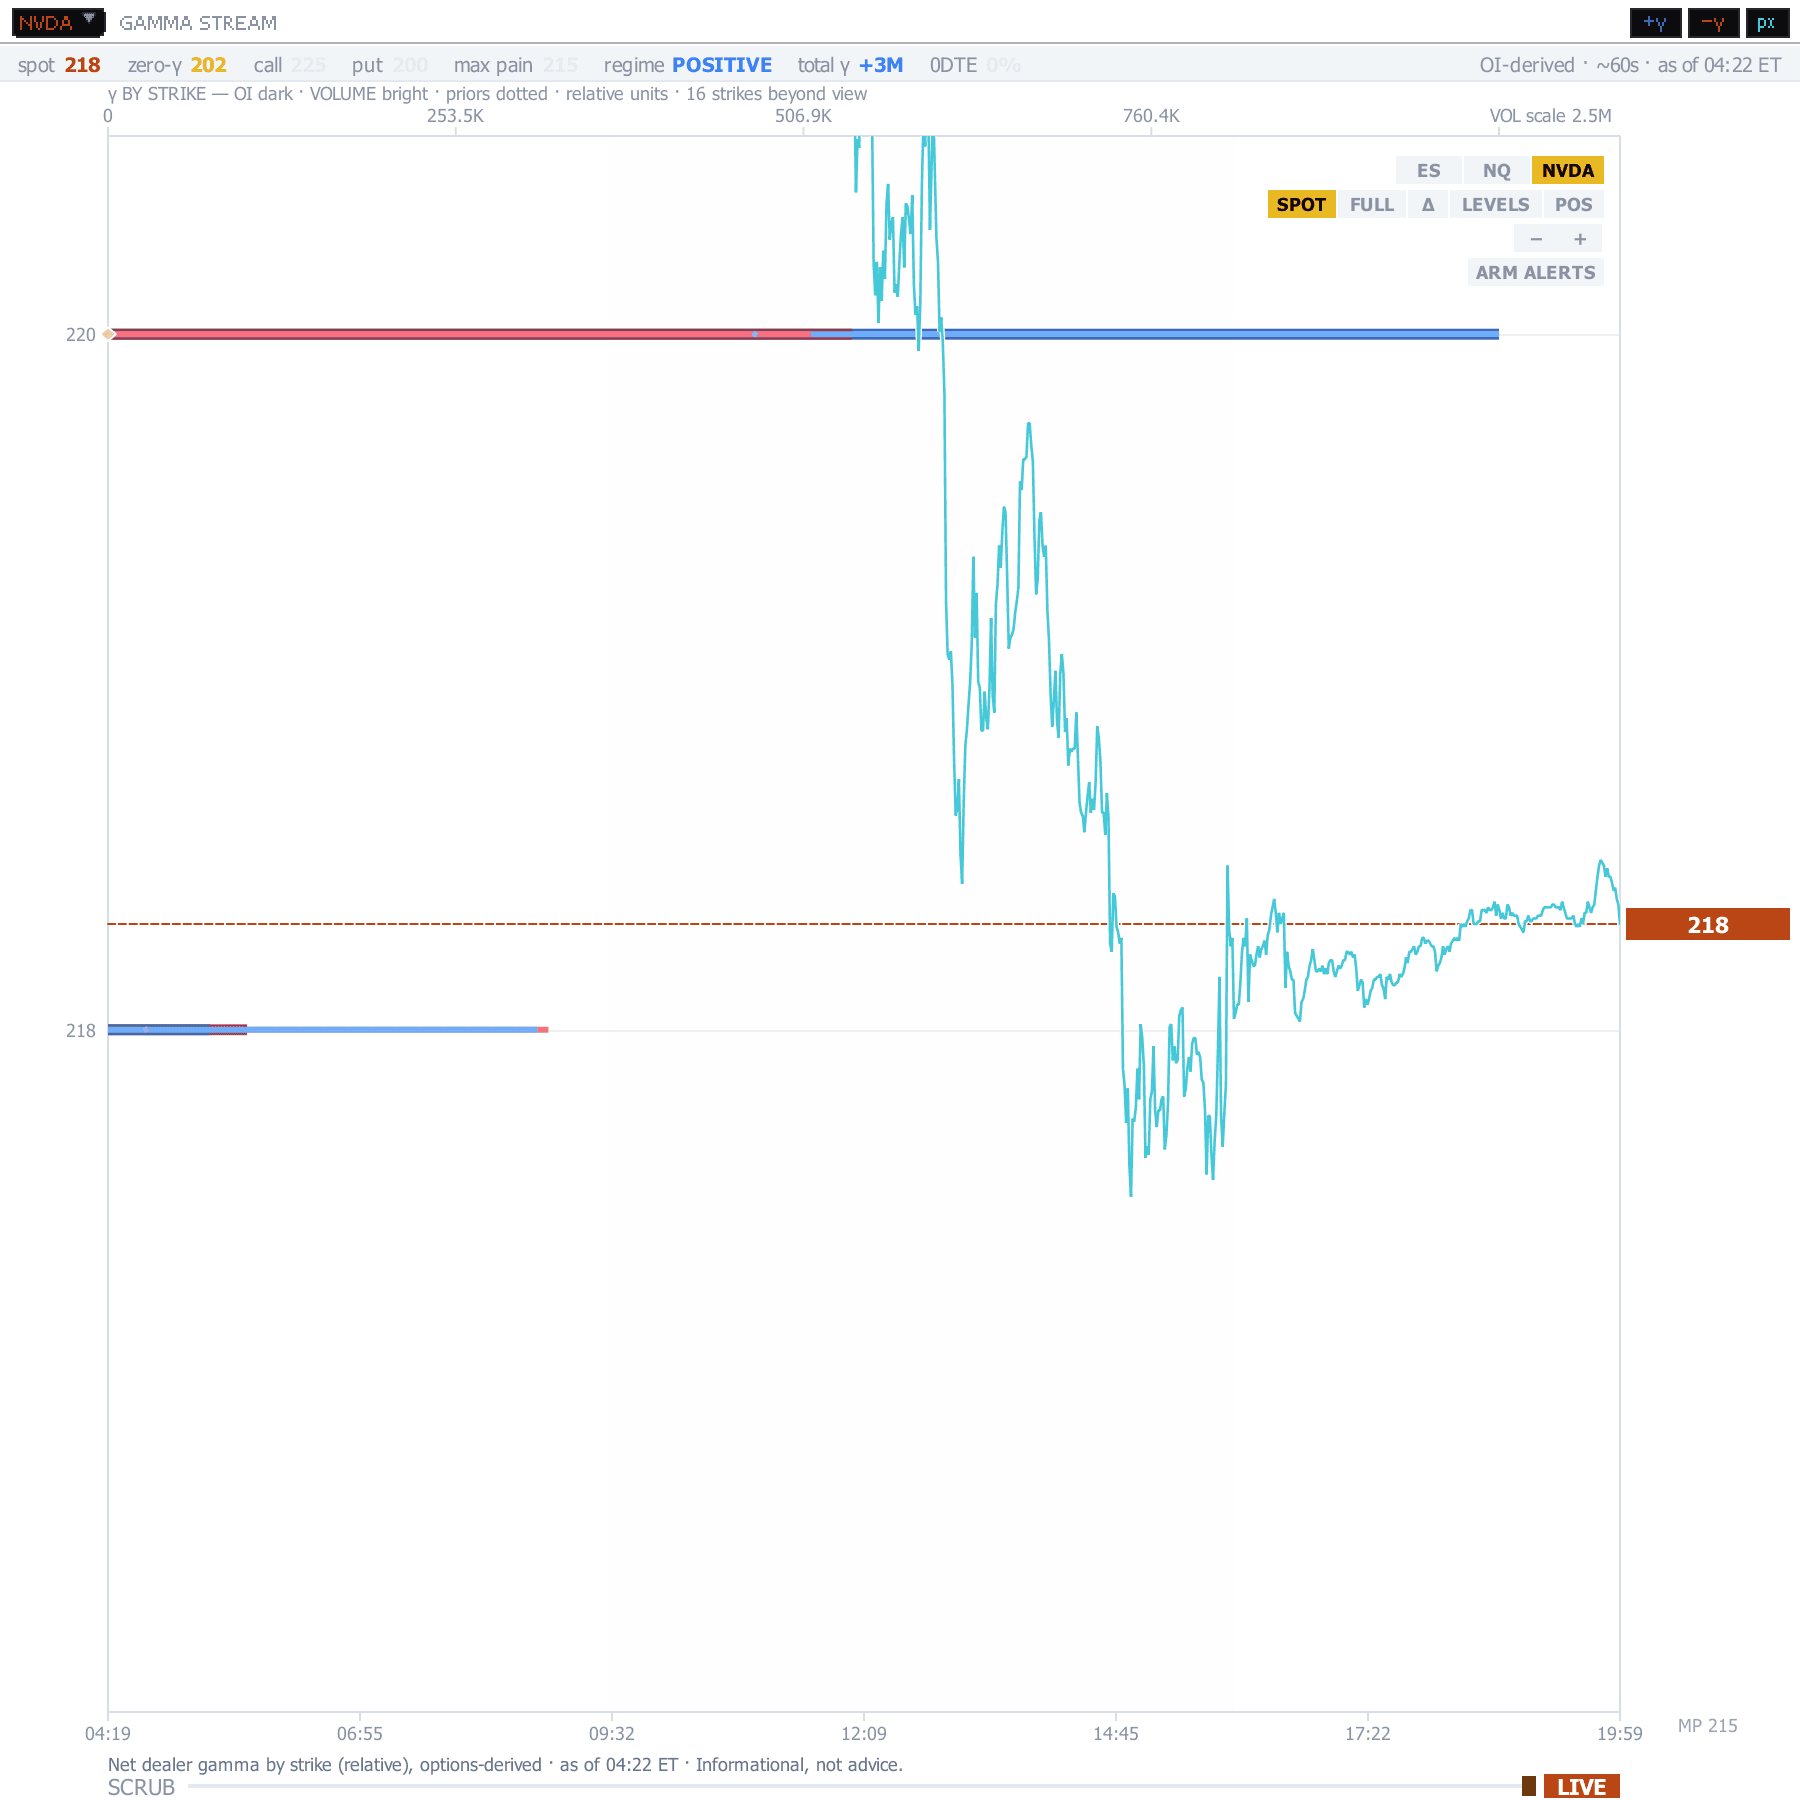
“GEX estimates aggregate dealer gamma by strike, marking where hedging flows tend to concentrate.”
GEX (gamma exposure) measures the aggregate gamma that options dealers have to hedge. Where that gamma concentrates, dealer hedging tends to dampen or amplify price — creating levels traders call walls, and a gamma-flip level where dealer behaviour changes character. The GEX panel computes those levels and draws them directly on the same chart as the DOM and the footprint, so dealer levels sit on the order flow you're already reading instead of in a separate dashboard.
It's part of the order-flow workspace and updates intraday as the gamma surface rebuilds — not a fixed morning snapshot.
| Call wall | The strike with the largest aggregate positive call-side gamma — dealers are most motivated to sell into it, so it tends to act as resistance. |
| Put wall | The symmetric put-side strike — dealers most motivated to buy, so it tends to act as support. |
| Gamma flip | The level where net dealer gamma crosses zero. Above it dealer hedging tends to dampen moves; below it, amplify them — a regime line. |
| Max pain | The strike where the most option value expires worthless — a magnet into expiration. |
| Expected move | The options-implied one-session range around spot. |
| High-gamma zones | Bands of concentrated gamma where hedging flow is heaviest. |
| Vanna / charm | Second-order level shifts as implied vol and time-to-expiry change through the session. |
| 0DTE percentage | How much of the day's option activity is same-day expiry — context for how fast the surface is rebuilding. |
Call-side and put-side levels are colour-coded and labelled on the price chart so you can see at a glance where the nearest wall sits relative to price. The same levels render on the DOM ladder using the same reference-level treatment as your other levels, so when price approaches a wall you read the absorption on the ladder at the same moment. Each DOM can carry its own symbol's GEX levels.
Enable GEX Levels from the chart's Custom Studies menu. The levels are computed for index and major-equity gamma; the panel maps an index future (for example ES or NQ) to its index gamma so the walls draw on the contract you trade.
The free Explorer tier shows GEX on SPY and QQQ on 15-minute delayed data, so you can see how it works. Real-time GEX and the full index / futures coverage are part of Pro.
