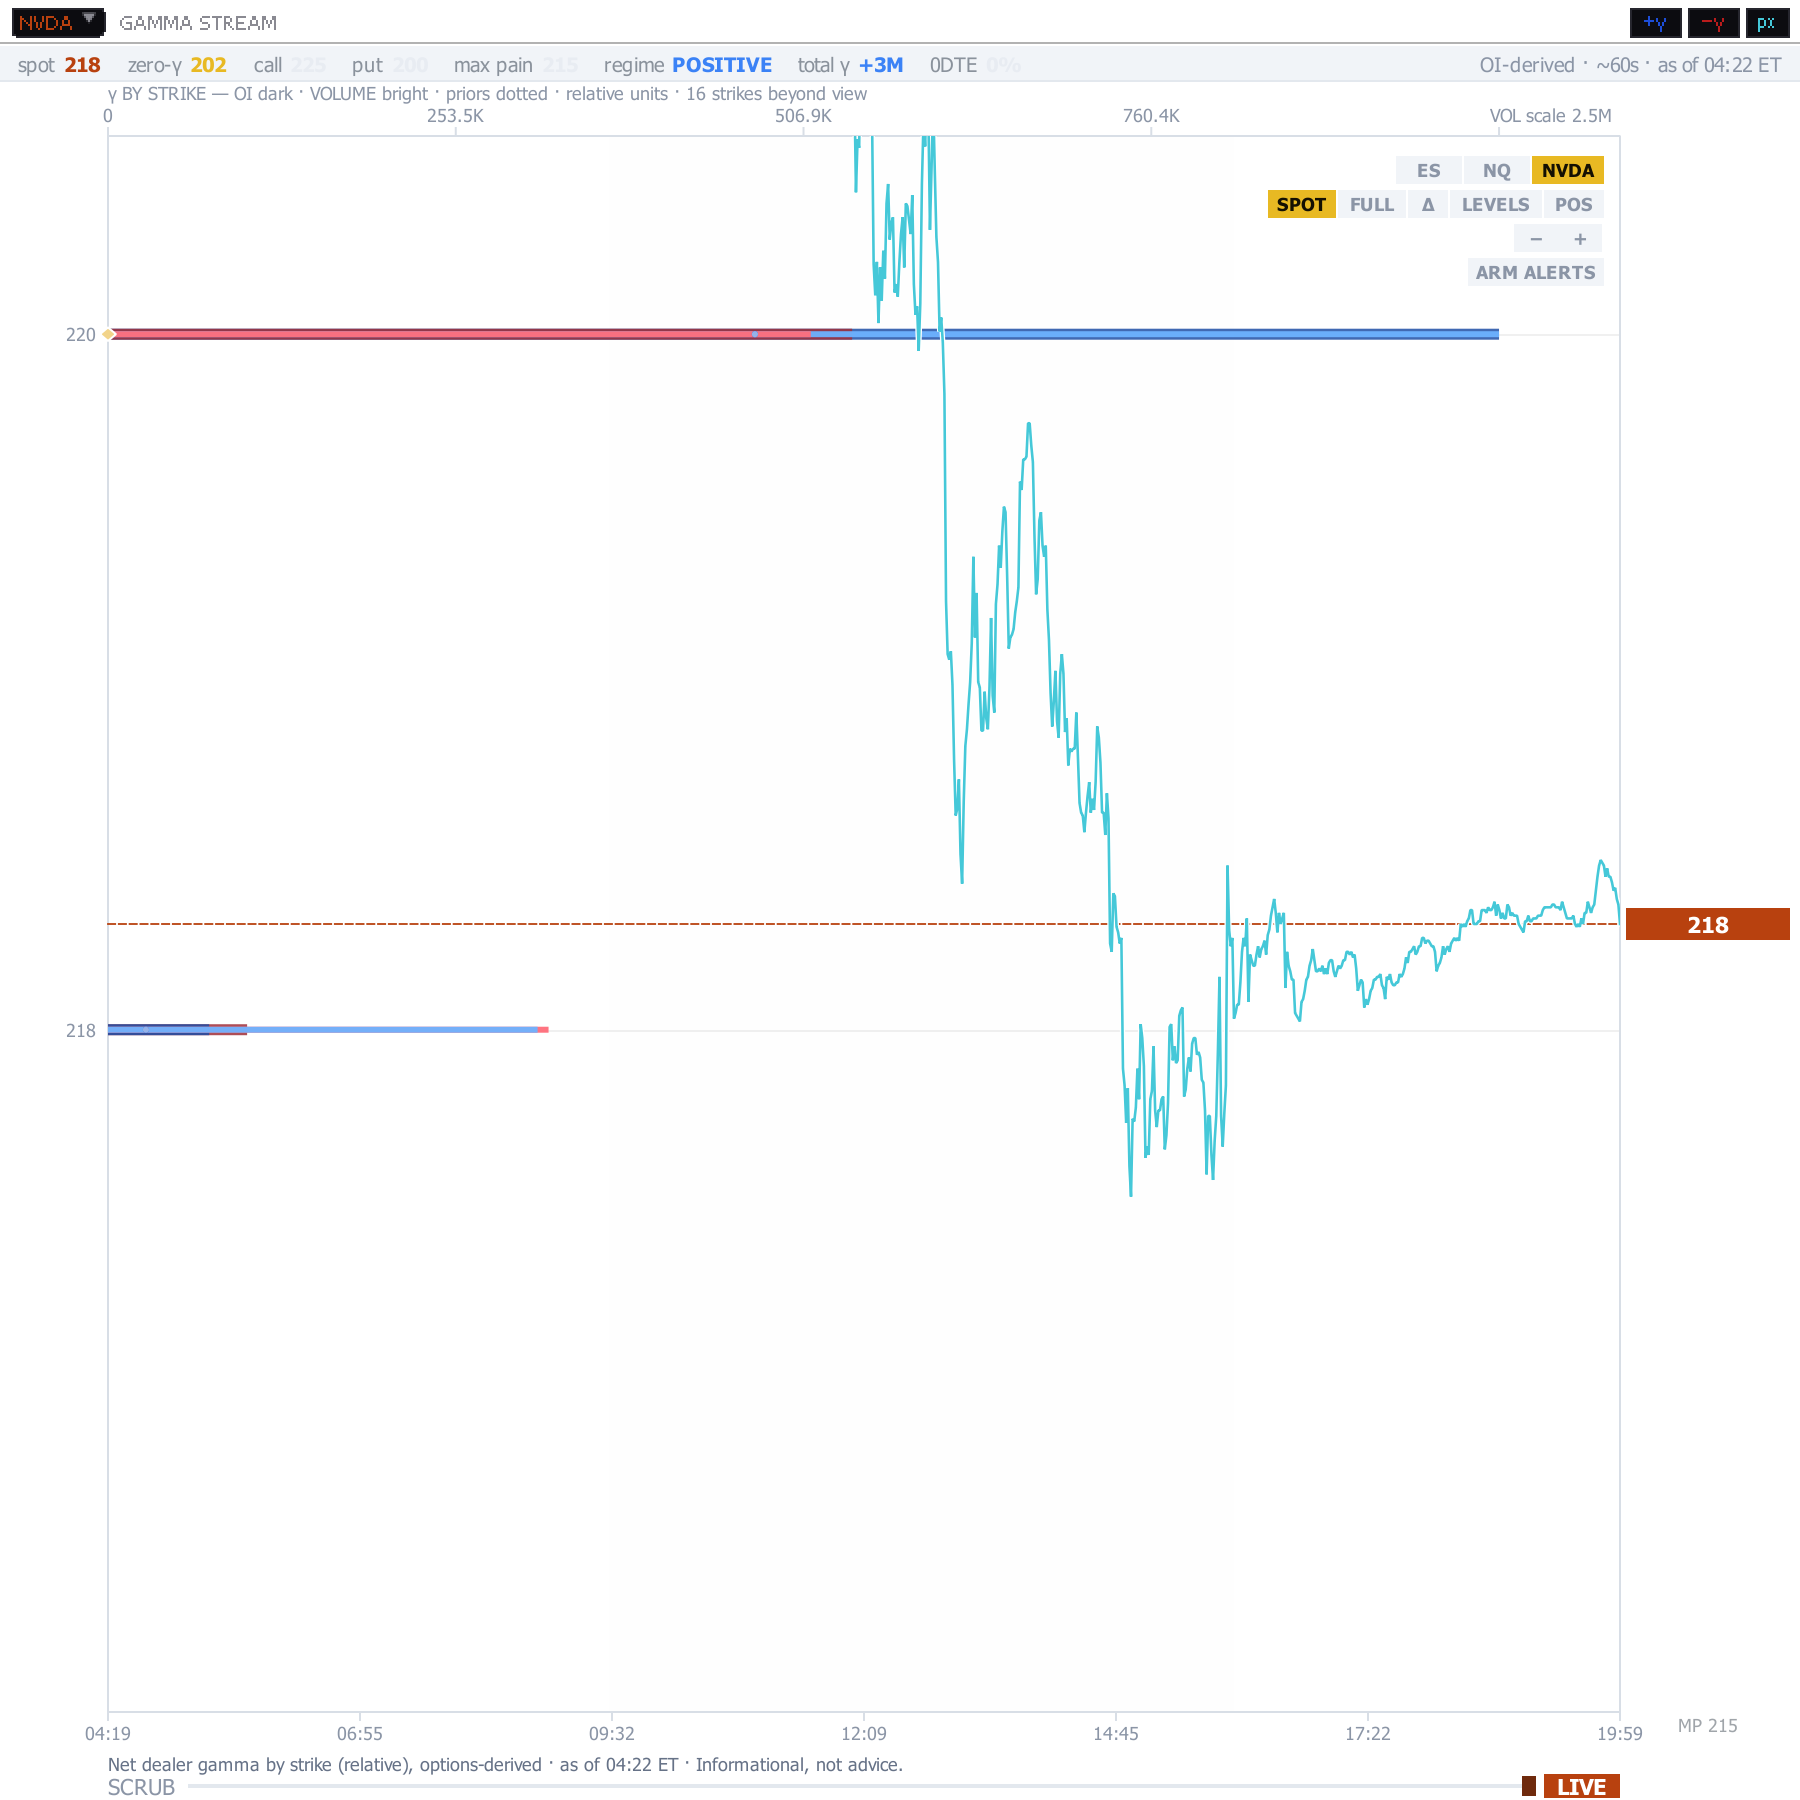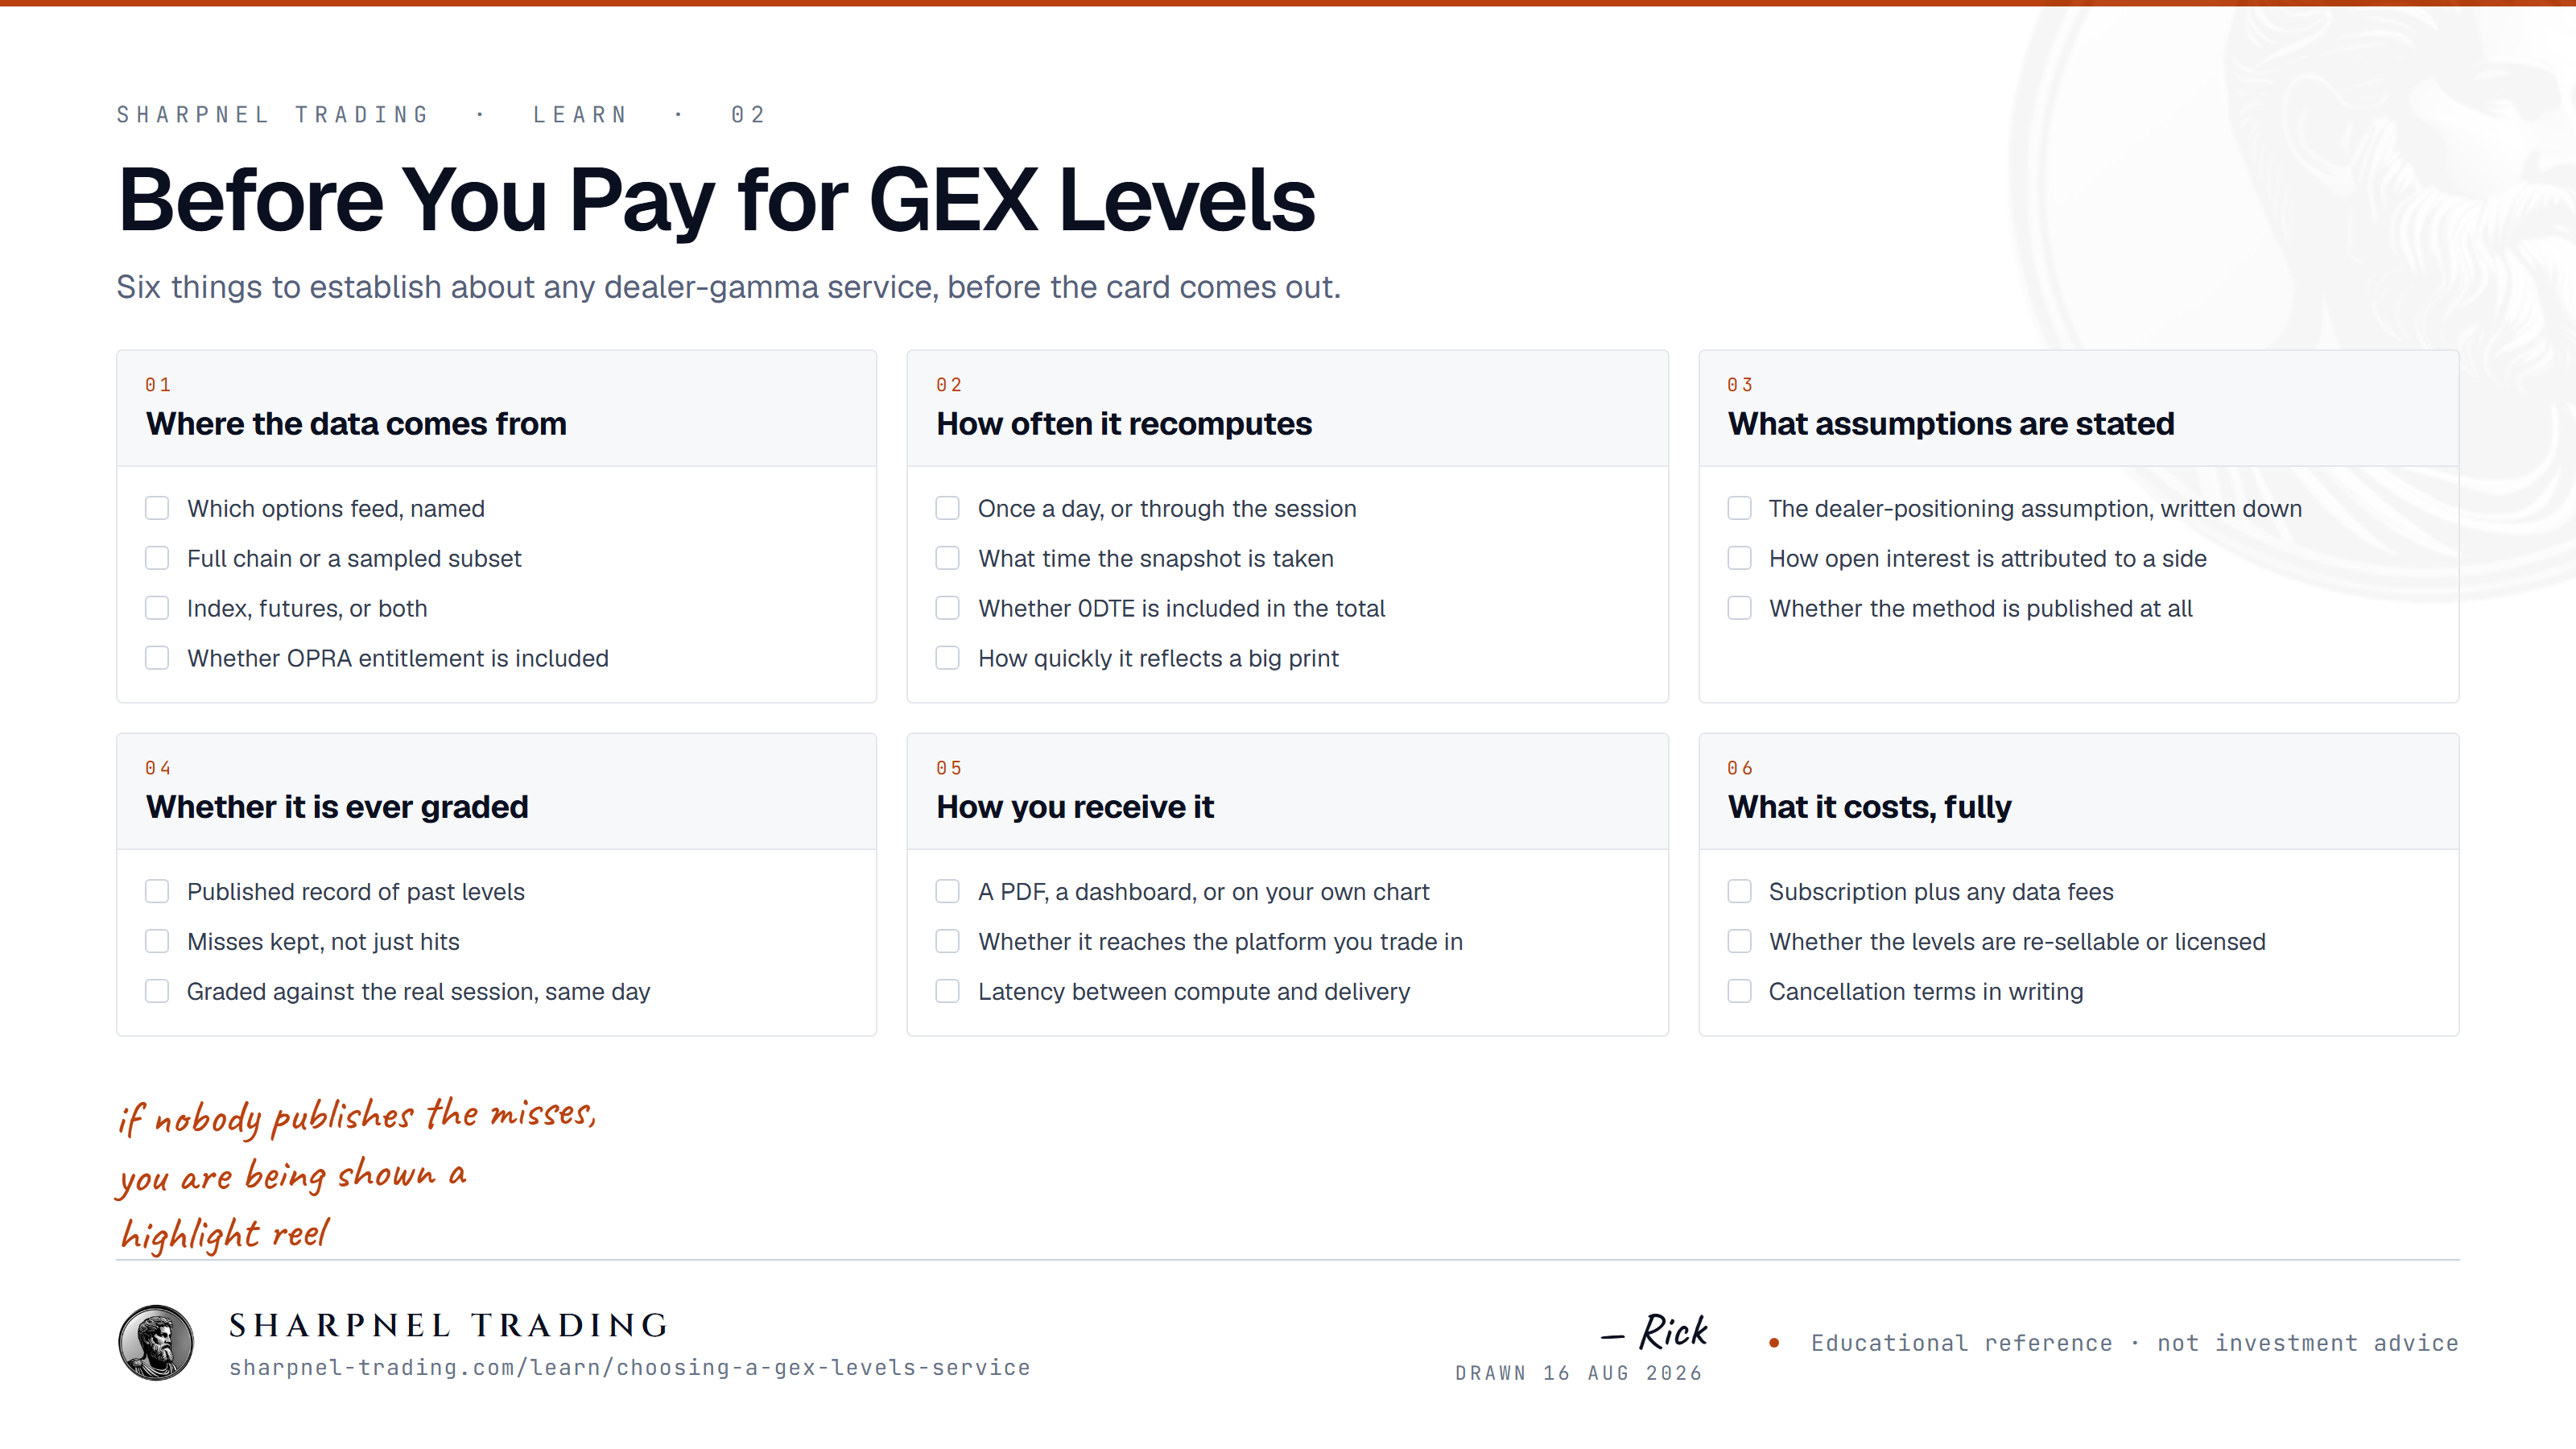
Dealer-gamma levels are sold by a lot of people now. The numbers they publish for the same index on the same morning are not the same numbers, and the differences are not small. Before you subscribe to any of them — including mine — it is worth knowing what actually varies, because almost none of it is disclosed on a pricing page.
I build a terminal that draws these levels, so I am not neutral. What I can do is tell you exactly which decisions produce different numbers, so you can ask anyone selling you levels how they made them.
What a GEX levels service actually sells you
Every provider does roughly the same four things:
- Pull the listed options chain for an underlying.
- Take open interest at each strike.
- Run it through an options pricing model to get gamma per contract.
- Weight by open interest, sum across strikes and expirations, and hand you the strikes where hedging pressure concentrates — usually a call wall, a put wall, and a gamma flip.
The six choices that make the numbers differ
Which chain they read. Index options and the index ETF's options are different markets with different open interest. A service quoting levels for the futures may be deriving them from the ETF chain and scaling. That scaling ratio is an assumption, and it is rarely published.
Which expirations they include. Some use the front expiry only. Some include everything inside 60 days. Adding or dropping a monthly expiry with heavy open interest can move a wall by a meaningful distance. Ask for the window.
Open interest or volume. Open interest updates once a day, after the close. Volume updates continuously but describes what traded rather than what is held. A service using yesterday's open interest is telling you where positioning was; one blending intraday volume is estimating where it is now. Both are defensible. They are not the same number.
The dealer-positioning assumption. This is the big one and it is almost never stated. Nobody can observe dealer inventory. The industry convention assumes dealers are net short customer flow on both calls and puts, which is an assumption, not data. Every level you have ever seen rests on it. A provider who tells you this openly is more trustworthy than one who presents the output as measurement.
How often it re-computes. A level published at 8:30 and never touched again is a different product from a surface re-measured through the session. Neither is wrong. But if your plan depends on knowing whether size drained off a strike by midday, a static morning number cannot tell you.
Where it lands. A dashboard you check in another tab, versus levels drawn on the chart you are already watching. This matters more in practice than it sounds — a level you have to go and look up is a level you will forget during the part of the session when it mattered.