Order book with Pull/Stack, MTF Value Area, Reconstructed Tape, DOM Volume Bars, and persistent VWAP / POC / gamma overlays. The headline order-flow surface.
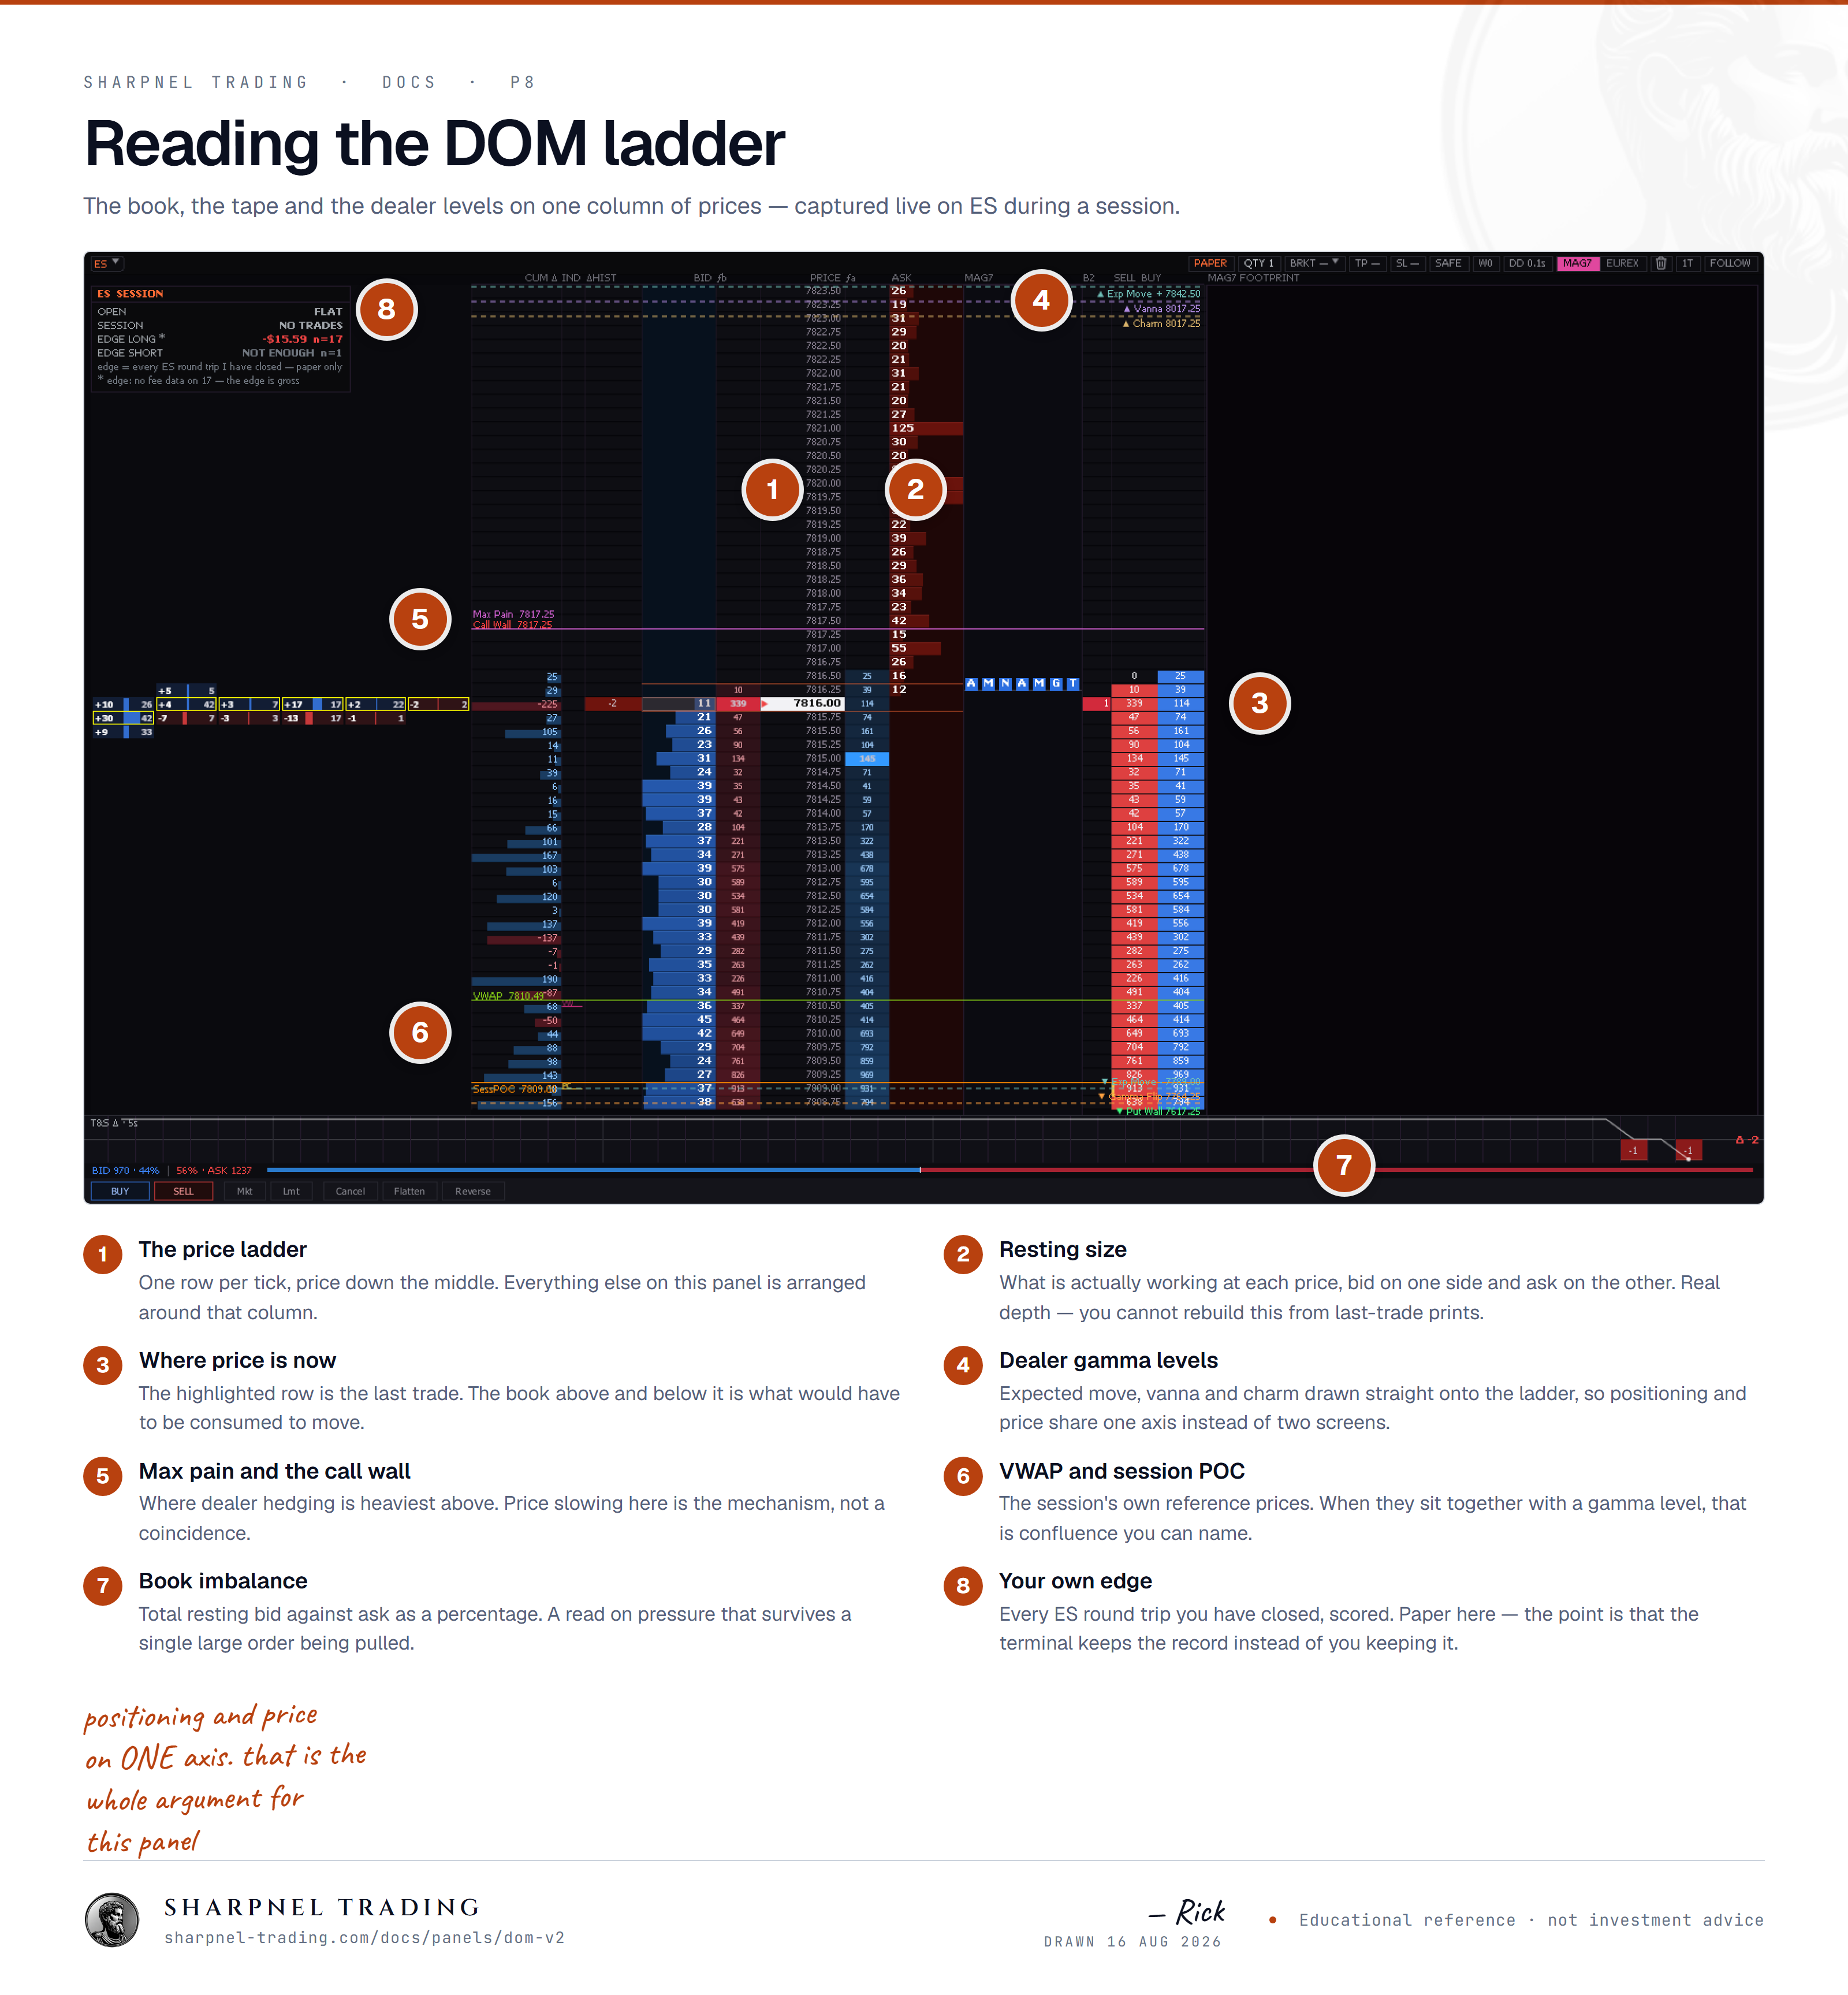
“The DOM is the order-flow ladder. On top of live bid and offer size it adds a pull-stack meter that shows what is being pulled out of the book or stacked into it, a seven-bar meter of the mega-cap names leading the index, and a reconstructed tape that classifies every print by side and size, so you read the intent a plain book leaves out.”
A standard order book tells you what size is sitting at each price right now. It's a snapshot. It doesn't tell you what just disappeared, what just appeared, or how fast either thing is happening. By the time you see the print on the tape, the participant who made the decision moved a second or two ago.
DOM V2 builds the column I needed for that — a real-time view of book deltas, classified prints, and multi-timeframe value, with persistent context lines drawn through the whole ladder so I never lose the levels that matter.
Ctrl+P, then # and the panel name.NQ DOMV2.multi-dom preset opens four DOM V2 instances pinned to ES / NQ / SPY / QQQ.Left-to-right, the 9 columns are:
Pull / Stack is the middle column. Three real-time book signals stacked into one strip — every read is leading, not lagging.
On their own, any one of these is noise. Together, they're a signal. When the ask side is being pulled, prints are hitting the offer, and bids are stacking below — that's an institutional bid building before the breakout, not after. You see the intent while it's forming.
The leftmost data column. Per-price session-cumulative net buy-vs-sell aggressor delta — for every price level in the visible window, the running sum of buy-aggressor volume minus sell-aggressor volume since session open. Blue bar + positive signed number where buyers absorbed sellers; red bar + negative signed number where sellers absorbed buyers. Length encoded by magnitude; bars anchor at the right edge of the column and grow leftward, with the signed number right-aligned on top.
This is the universal DOM-scalper read for level absorption: where has size actually built up on one side over the entire session, not just in the last few seconds. A row stays empty when buys exactly cancelled sells (net zero) or no trades happened at that price — the column spotlights only meaningfully imbalanced levels.
The four cross-ladder yellow horizontal lines through this column come from the MTF VBP computation — see Persistent overlay lines.
The Bid stack (immediately right of the price column) and Ask stack (one column further right, with DOM Volume Bars between them) show resting depth at every price level. Universal-DOM histogram bar style:
(size / P90_of_visible) × cell_width, floored at 2 px so even a 1-lot row shows a visible stub against the dim ladder backdrop. P90 normalization keeps a single 500-contract outlier from crushing every other cell into the dim half of the gradient.The inside row (BBO bid / BBO ask) appends an age suffix — seconds, minutes, or hours since this price first appeared at the top of book. Resting time at the inside is the primary anti-spoof read. A bid that's been there for 90 seconds is a different animal from one that appeared 200 ms ago.
Sits between the bid stack and the ask stack — adjacent to the price column. Four cells per row showing the latest volume bars' per-level splits, colored by delta sign: blue when buy-aggressors dominated this row on the bar, red when sell-aggressors did. Width proportional to volume.
What this gives you: a footprint-style read of the last few volume bars without leaving the ladder. You see where the aggressive flow actually landed before price moved, alongside where it's still sitting in the bid / ask stacks on either side.
Sits between Pull / Stack and Reconstructed Tape on the right side of the ladder. Different timescale from DOM Volume Bars: rather than per-bar splits, this column shows a rolling 5-second window of per-price volume with delta-signed coloring. Blue if buy-aggressors dominated this price in the last 5 seconds; red if sell-aggressors did.
Three delta-flavored columns at three different timescales — session (Cumulative Delta), per-bar history (DOM Volume Bars), rolling 5-sec (Bid Stack 2) — let a scalper read the same signal at the speed they need it. Session for level absorption conviction, per-bar for the last few minutes of pressure, 5-sec for "is this price being lifted RIGHT NOW."
The rightmost column. Every print classified by aggressor side (buyer-aggressive vs seller-aggressive) and grouped into size cohorts. Single-lot prints don't render — the noise floor is filtered so the cohort cells read as discrete events, not a streaming wall of digits.
Read it as a time series: each cell is a print or a cluster of near-simultaneous prints at this price level, with the cell color carrying the aggressor side and the cell size carrying the cohort weight. The tape, but readable at a glance.
Horizontal lines drawn across the entire ladder, starting from MTF VA's right edge and extending to the right edge of the ladder. Each line carries a small label at its left start so you always know which level you're looking at.
30m POC / 12m POC / 5m POC / 2m POC. Each marks the price row where the corresponding exponentially-weighted volume profile peaks. Tells you which lookback windows have their value-area peak at which level, at a glance.2m POC overlay line migrates upward through the cluster. Lines hold (VWAP unviolated). Setup for upside continuation.2m POC line drops below price. Setup for a fade back into the value area.DOM V2 ships with one theme — red asks, blue bids, dark backdrop. Matches the rest of the terminal's default palette. The reference research bundle covers seven additional themes but the multi-theme switcher is intentionally not shipping — one consistent visual register reads better than per-panel cosmetic variance.
The multi-dom preset opens four DOM V2 instances side-by-side, pinned to ES / NQ / SPY / QQQ by default. Each panel has its own complete per-symbol data pipeline — Cumulative Delta, trade ring (DOM Vol Bars / Bid Stack 2 / Recon Tape / Pull-Stack T&S delta), VWAP, Session POC, MTF profiles for POC overlay lines, and gamma walls are all computed and stored independently per symbol. Open four panels for ES / NQ / SPY / QQQ and you see four genuinely independent order flows, not four views of the same ring.
Per-panel pins are persistent across reloads. Right-click any DOM V2's prompt strip to repin to a different symbol. Switching pin re-fires the 24h cum-delta backfill for the new symbol; expect a half-second delay before the column repopulates.
CME FX futures (6E, 6B, 6J, 6A, 6C, 6N, 6S, 6M) trade at different minimum-tick increments than ES / NQ at their display scale. The ladder auto-detects the right tick per symbol so every visible row corresponds to a price that can actually have data:
Without per-symbol ticks, FX ladders rendered at 0.25 stepping would show half the rows as mathematically empty (prices that can't physically have a trade or resting size on that contract). That bug — visible as alternating empty rows in bid stack + cum-delta — is gone as of l794. Treasury contracts (ZB 1/32, ZN 1/64) are on the roadmap.
When a trade hits, the row at the trade price gets a brief ~270 ms border pulse + a floating "+N" size tag showing exactly how many contracts hit. The pulse color is a slightly brightened version of the side's own bar color (deeper blue for buy-aggressor lifting the ask, deeper red for sell-aggressor hitting the bid) — palette-matched to the rest of the ladder, no neon mint or hot pink anywhere. Matches the institutional orderflow convention.
