28 live geographic data layers, every dot drills to a tradable instrument.
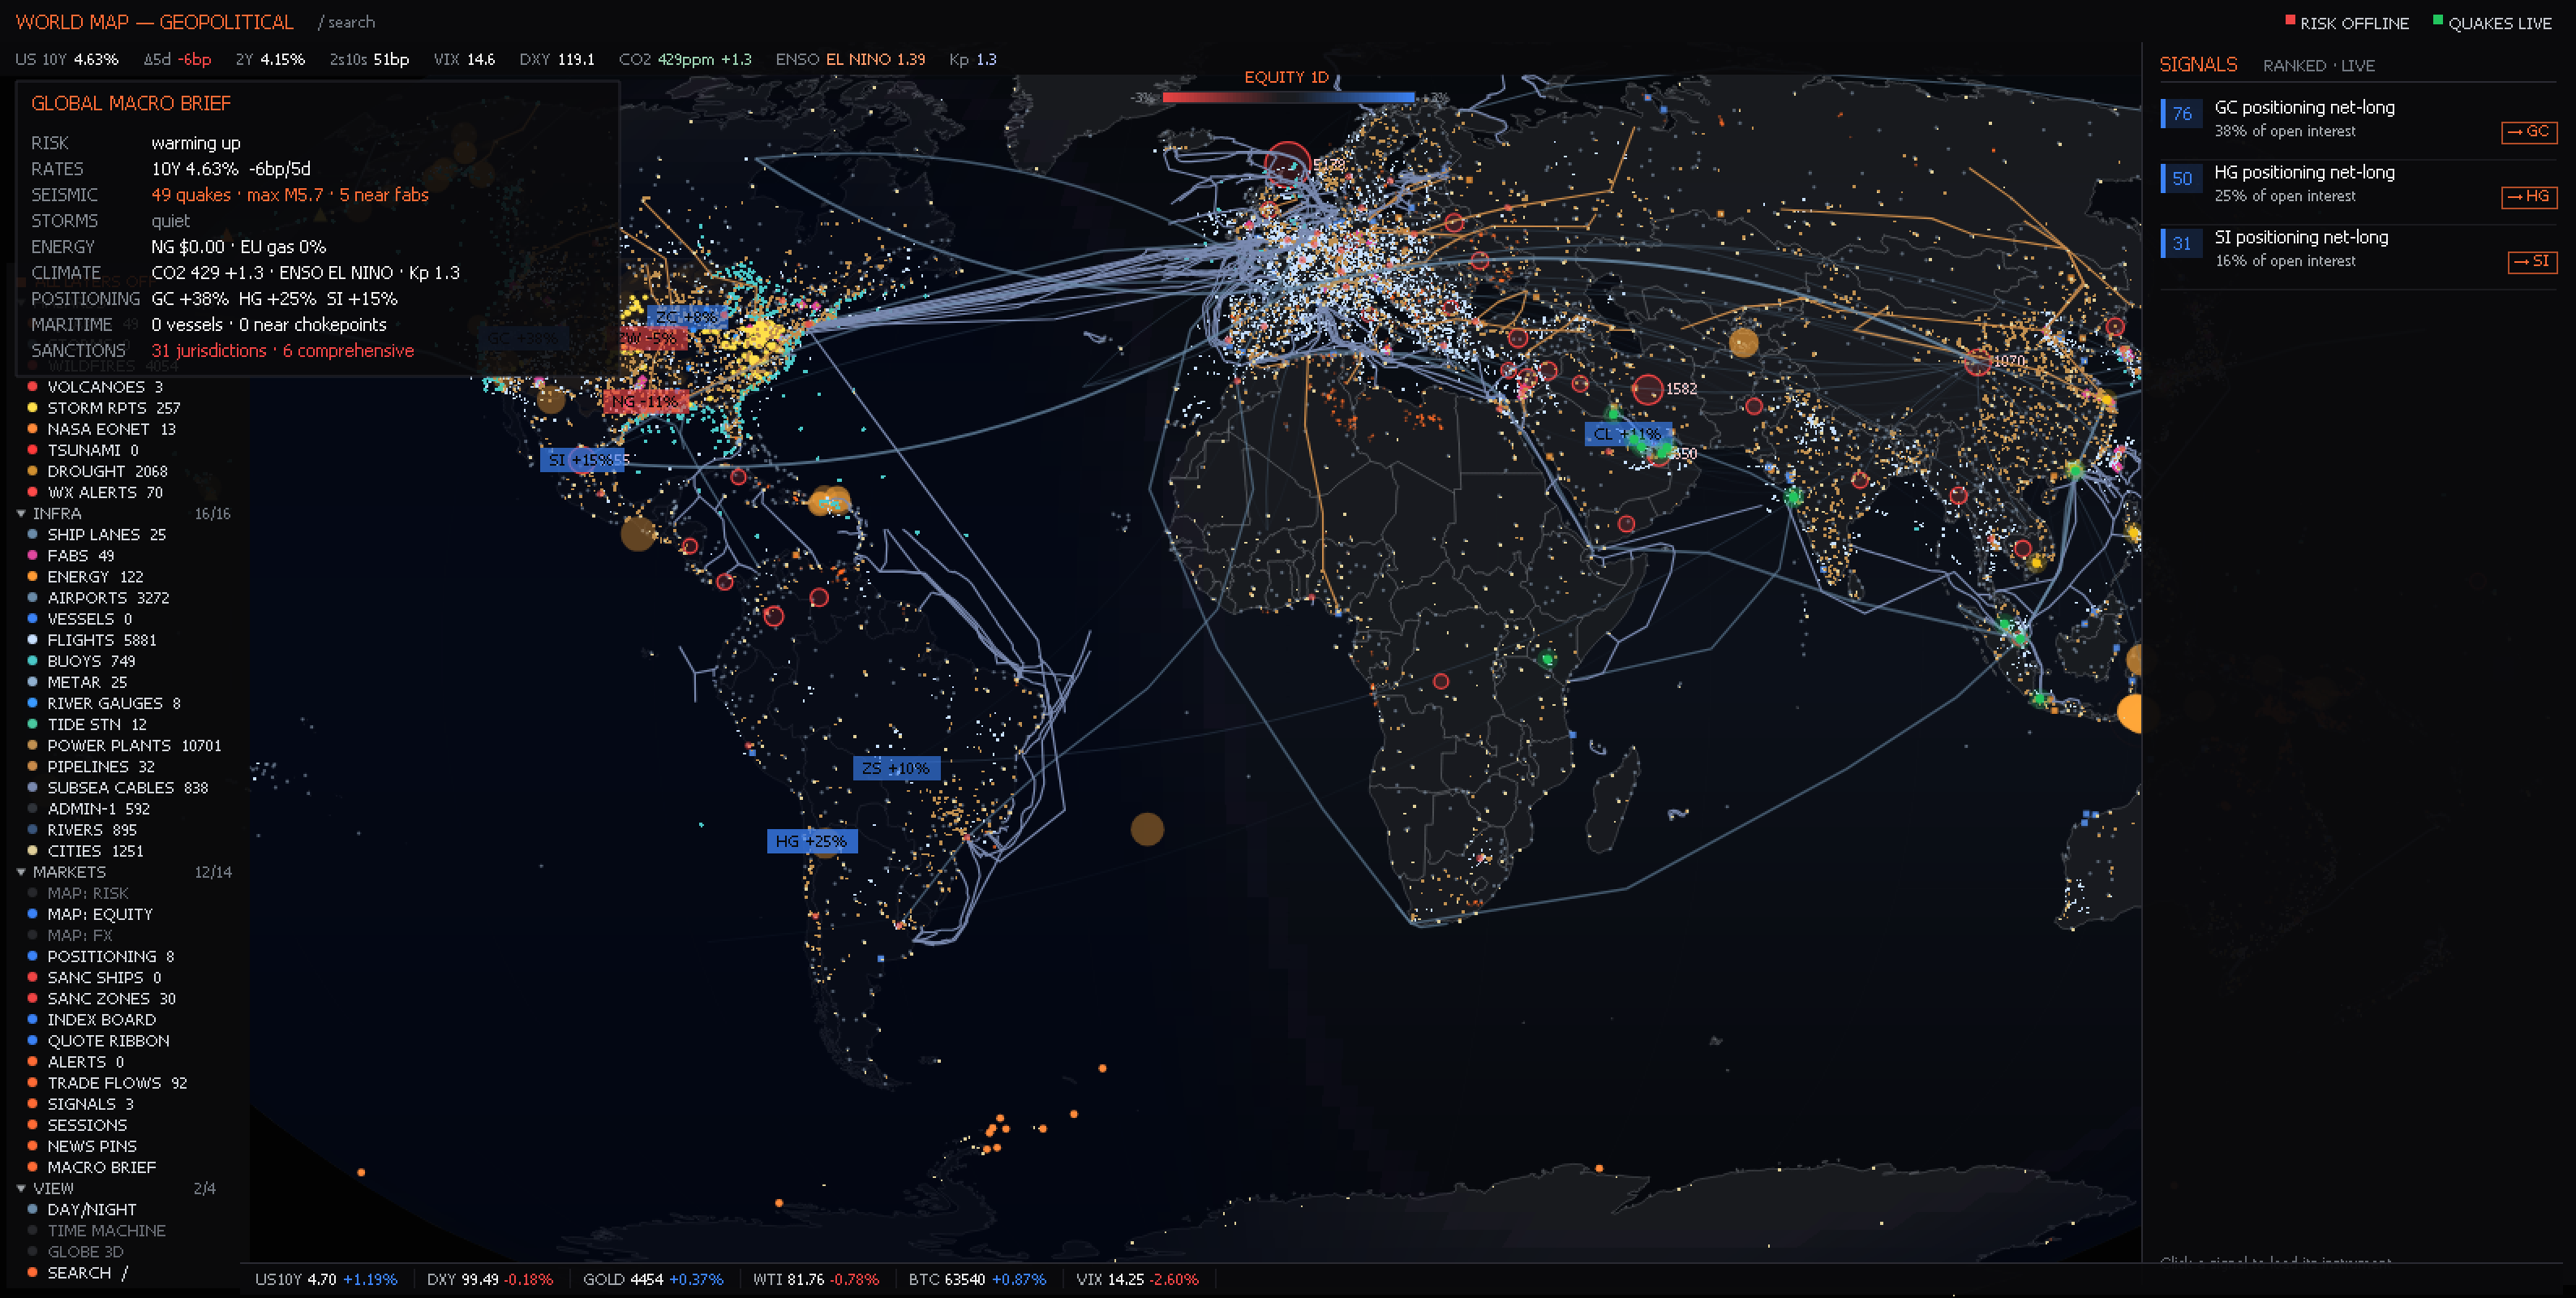
A live globe of eleven toggleable layers — flights, vessels, weather, earthquakes, shipping lanes, airports, semiconductor fabs, power plants, pipelines, refineries, LNG terminals — with a day/night terminator sweeping westward across the map and hover tooltips that link every asset back to the tickers that care.
28 live geographic data layers, every dot drills to a tradable instrument.
Open itAdd Panel ▸ Macro ▸ Global & FX ▸ World Map
Robinson projection over Natural Earth polygons in 2D. Toggle the GLOBE chip in the LAYERS column and the map flips to an orthographic 3D sphere — drag to rotate, scroll to zoom. Day/night terminator updates in real time. Major trading hubs (NY · London · Frankfurt · Tokyo · Singapore · Hong Kong) stay labelled across zoom levels.
Right-edge chip stack: FLT live ADS-B / VSL live AIS · WTHR storms · EQ quakes · SHP shipping lanes · APT airports · FAB semi fabs · PIPE pipelines · REF refineries · LNG terminals · CBL submarine cables · WLD active wildfires · VLC volcano alerts · SAN enforcement events · TSU tsunami warnings · EON consolidated natural events · DRT drought polygons · BUO ocean buoys · LSR storm reports · RIV river gauges · TID port water level · COT futures positioning ribbon · MET hub airport METARs.
Top of the LAYERS column: four preset buttons that toggle the right combination of chips for a desk. ENERGY → chokepoint vessels + refineries + LNG + barge gauges + sanctions tape. AG → drought + river + storm reports + EONET (floods/dust) + COT. MACRO → sanctions + COT + cross-asset event tape on the 3D globe. VOL → short-fuse events only (storms · tsunami · LSR · quakes · volcanoes · METAR ground stops). The active preset highlights when state matches; toggle any chip to fall back to the chip-by-chip view.
Live tanker count, rolling-30-day baseline, Z-score versus baseline, anchored count, implied move on the right futures contract (Brent for Hormuz · Bab · Suez · Singapore, CBOT wheat for Bosphorus, Henry Hub for the LNG-flagged Hormuz traffic). Tab strip swaps chokepoints in one click; map auto-pans to the polygon. When density crosses 2.5·sigma the polygon glows orange, the map raises a critical-tier audio cue, the headline bar updates, and the card auto-promotes.
192+ infrastructure points are click-to-trade. Pipeline (Druzhba → Brent · Yamal-Europe → TTF · Power of Siberia → JKM · Colonial → RBOB) · refineries · LNG export/import terminals · sanctioned countries · fabs · river gauges (Memphis → ZS basis) · port tide stations. Click a sanctioned vessel and the workspace pulls the regional anchor. ~740 specific tankers indexed by IMO / MMSI from the OpenSanctions consolidated registry.
Top-right: K index (geomagnetic state — grid + GNSS reliability), ENSO state (El Nino · Neutral · La Nina with ONI value + 3-month trend), Mauna Loa CO2 ppm with year-on-year delta. Bottom: CFTC Commitments of Traders weekly ribbon — net non-commercial positions across WTI · NG · gold · silver · copper · corn · soy · wheat plus week-on-week delta. Position-of-traders extremes at a glance.
Shift-click anywhere drops a 100 km great-circle ring. The aggregates panel shows infrastructure exposure inside: vessels by type, refinery capacity in K BPD, LNG capacity in MTPA, fab count. Drop on Hsinchu → TSMC fabs at risk; drop on the Strait of Hormuz → tanker concentration plus refinery capacity. Escape clears. Double-click empty ocean to reset pan / zoom.
`WMAP UA` zooms to Ukraine. `WMAP TW` to Taiwan. `TSM WMAP` rings TSMC facility locations and retargets the chart cascade — two effects from one publish. Click a country polygon for the drawer (regional indices · currency · central-bank chair · key trading hours · top traded sectors). Trade-flow arcs to top-5 export partners on the 3D globe when a drawer is open.
Ctrl+P, then # and the panel name.WMAP, BMAP, ECTR.UA WMAP, TW WMAP.TSM WMAP.The panel itself is visible to every account. Three of the eleven layers — FLT (flights), VSL (vessels), and WTHR (weather) — stream live data every minute and are Pro-only. The other eight layers (static curated datasets) are free on every tier.
