CPI / Core CPI / PCE / Core PCE / PPI YoY vs the 2% Fed target.
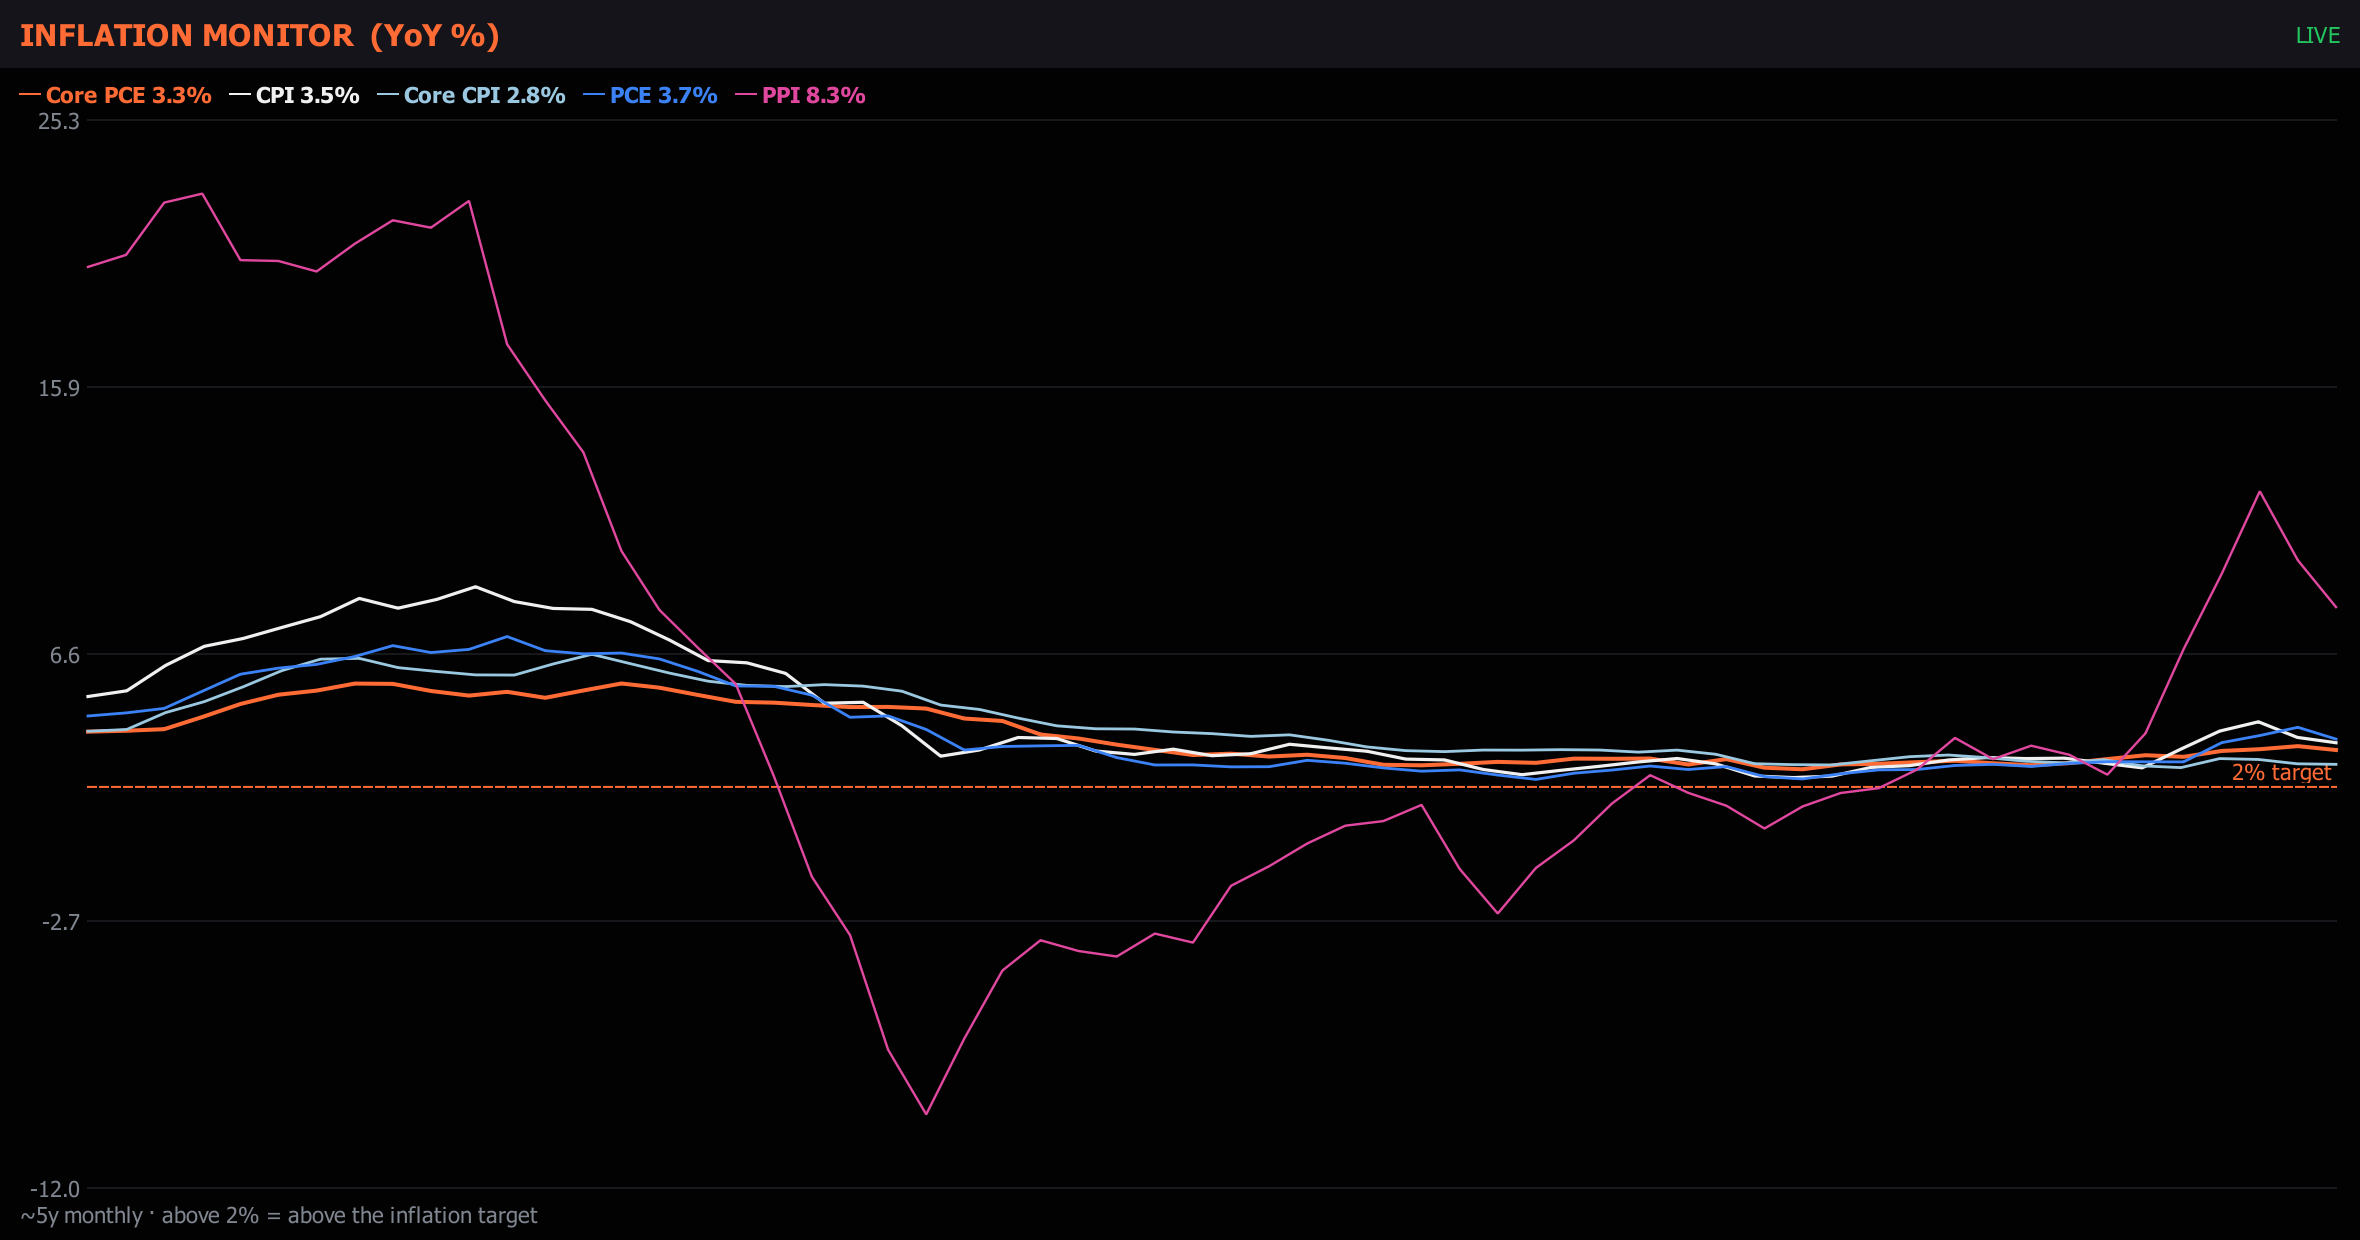
A multi-series year-over-year chart of the five inflation gauges the Fed and market actually watch: CPI, Core CPI, PCE, Core PCE, and PPI. The Fed's preferred measure — Core PCE — is drawn with a thicker stroke. The Fed's 2% target is a dashed reference line.
CPI / Core CPI / PCE / Core PCE / PPI YoY vs the 2% Fed target.
Open itAdd Panel ▸ Macro ▸ Growth & Inflation ▸ Inflation Monitor (CPI/PCE/PPI YoY vs 2% target)
Headline CPI, Core CPI, headline PCE, Core PCE, PPI all plotted as YoY time series with the Fed's 2% target as the reference line. Core PCE is the Fed's preferred measure — that's the line that moves cuts.
Headline CPI above Core CPI = energy + food driving the print (transitory). Core trending up while headline cools = sticky services inflation (the harder problem; persistent rate path).
Type FFIP to compare the inflation trajectory to what the market is pricing for FOMC outcomes. Stickier-than-priced inflation = surprise hawkish repricing risk.
Ctrl+P, then # and the panel name.Add Panel › Macro › Growth & Inflation › Inflation Monitor. The command palette (Ctrl+P) finds it by name too.