Last 90 days of US Treasury auction results.
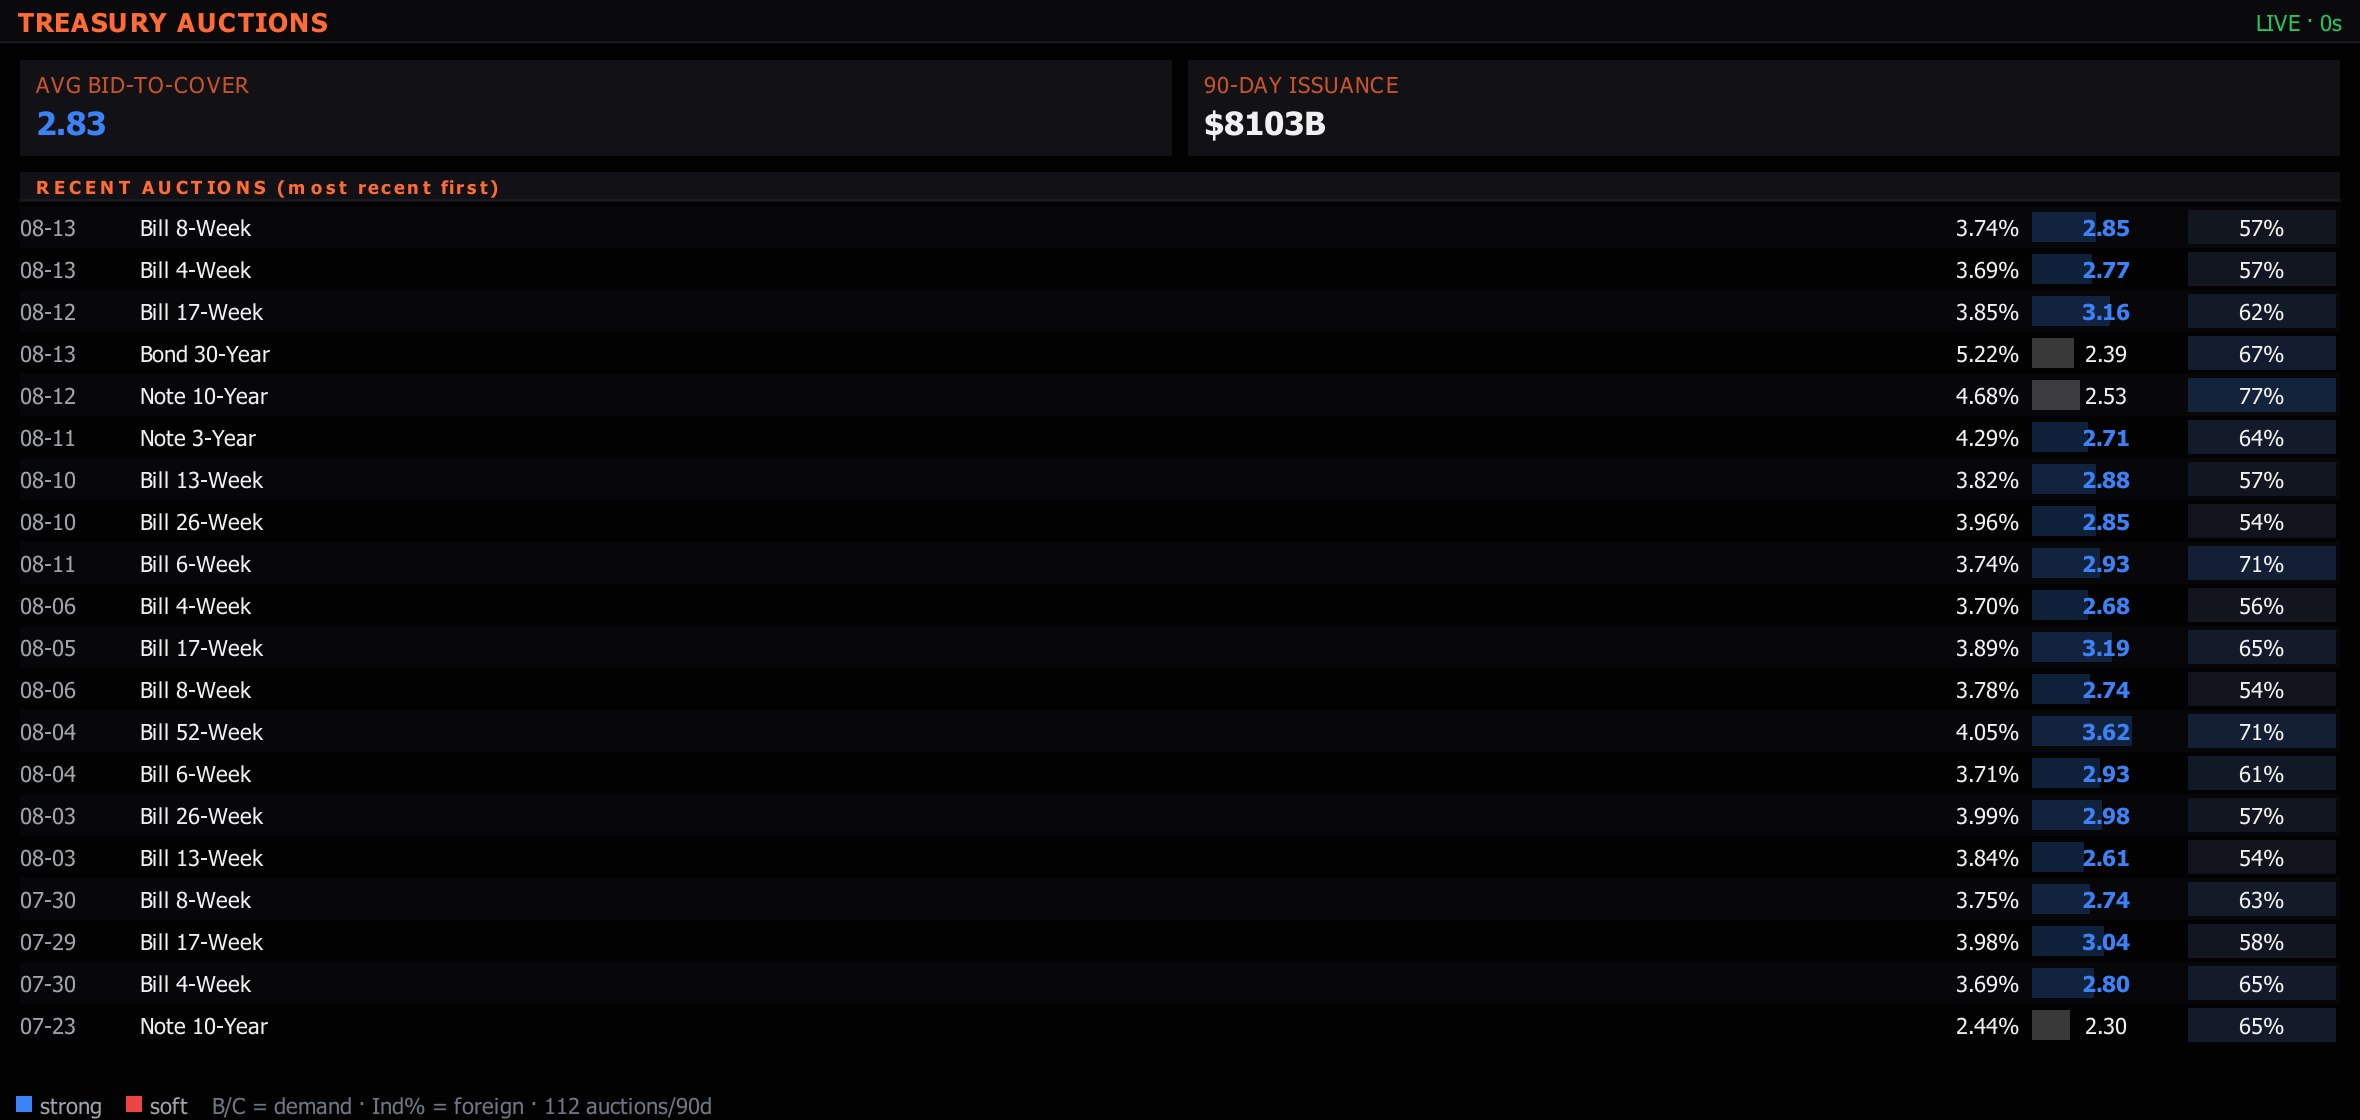
Tabular view of recent US Treasury auction results — the rates-desk daily-driver. Each row is one auction: date, security type and term, offering size, high yield, bid-to-cover ratio, and indirect / direct / dealer bidder breakdown.
Rates traders watch every auction. Strong bid-to-cover plus high indirect-bidder participation (foreign central banks) means healthy demand. Weak BTC plus a heavy dealer take is a supply struggle — signals rates at risk on the next leg.
Last 90 days of US Treasury auction results.
Open itAdd Panel ▸ Macro ▸ Fiscal & Government ▸ Treasury Auctions (bid-to-cover demand tape)
4-week / 8-week / 13-week / 26-week / 52-week bills, 2y / 3y / 5y / 7y / 10y / 20y / 30y notes and bonds, TIPS, FRNs. Each row: tenor, size, high yield, bid-to-cover, indirect / direct / dealer breakdown.
B/C > 2.5 = strong demand; < 2.0 = soft (dealers forced to take down). Trending B/C readings tell you whether the curve has structural buyers or whether it's leaning on primary dealers — the latter is a tell for term-premium expansion.
Indirect = foreign + central banks via intermediaries; the cleanest "foreign demand" proxy. Direct = pension / insurance domestic end-buyers. Dealer = primary dealer take-down (residual). Foreign indirect collapsing = de-dollarisation tell.
When the high yield > the when-issued (WI) yield at auction time, the auction "tailed" — weaker than expected. Stops-through (high yield < WI) = stronger. Tail by > 2bp on a long-bond auction is one of the biggest signals in fixed income.
Ctrl+P, then # and the panel name.Add Panel › Macro › Fiscal & Government › Treasury Auctions. The command palette (Ctrl+P) finds it by name too.Two complementary signals:
The combination is the read. Strong BTC + strong indirect = the auction sailed through. Weak BTC + dealer-heavy take = primary dealers absorbed supply they couldn't place with end buyers, which often pressures the on-the-run in the days after.
Server queries the US Treasury Fiscal Data API (api.fiscaldata.treasury.gov) forauctions_query over the trailing 90 days. Public endpoint, no auth, no rate-limit issues. Cached server-side at 5 minutes — auctions happen on a weekly schedule and results land mid-afternoon ET, so faster polling is wasted.
