Time-Price-Opportunity letters. Composite and split modes.
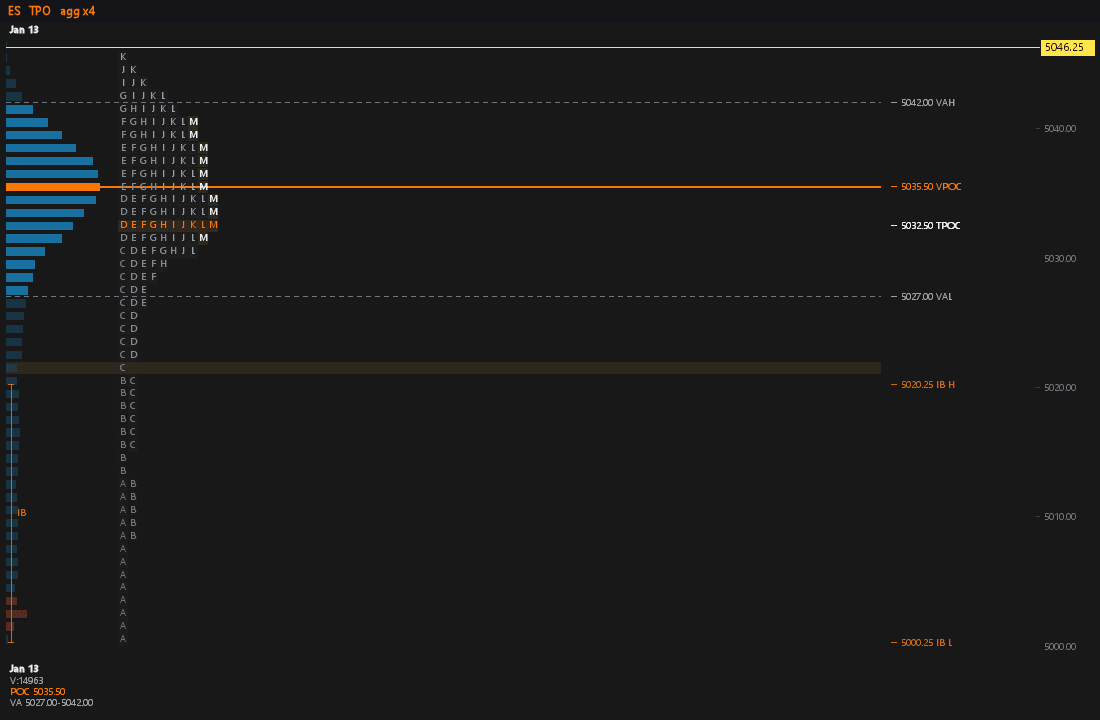
“The TPO builds a sideways profile of how much time price spent at each level over the session.”
TPO (Time-Price-Opportunity) stacks a letter for every 30-minute half-bracket a price traded in. The result is a sideways histogram — wide at the prices the market kept revisiting, narrow at the prices it rejected quickly.
The dedicated TPO panel is a full-canvas workspace built to live on its own screen — a first-class chart-family surface alongside the chart and the footprint, not a cramped sidebar. The densest row is the Point of Control (POC); the thin single-letter edges mark where price moved through without pausing.
Time-Price-Opportunity letters + value area + POC + IB extremes.
Open itAdd Panel ▸ Order Flow ▸ TPO (Multi-period profile)
Y axis = price. Each letter = one 30-minute period within the session that traded at that price. Same letter at multiple prices = the market spent that 30min covering that range.
Value area = the 70% of session volume bracket. VAH (Value Area High) at top, VAL (Value Area Low) at bottom, POC (Point of Control = highest-volume price) in the middle. Outside-VA prices = excess; market typically rejects.
First hour of session establishes the IB high and low. Range that holds for the rest of the day = balanced day. Range that breaks = trend day; the breakout direction usually continues.
Bell-shape (D-distribution) = balanced day; revert to POC. P-shape = bullish trend; expect continuation. b-shape = bearish trend. Multi-peak (b+P or P+b) = transition day.
Toggle to composite mode: multiple sessions merged into one profile. Reveals long-term value zones (HVN = high-volume node, LVN = low-volume node). LVNs act as gaps; price tends to traverse them quickly.
Ctrl+P, then # and the panel name.ES TPO — opens it on that symbol.The panel draws four profile columns next to each other so you read short-term and long-term auction context in one glance — no toggling between views:
The four labels are the default. You can relabel the columns to match a session-based workflow — for example ASIA / EU / US / Overnight — and the terminal persists your labels across restarts.
Each column renders in one of three styles:
The live Session column develops between data refreshes — each executed print folds into the forming profile in real time, so the current auction is never frozen a bar behind the tape.
