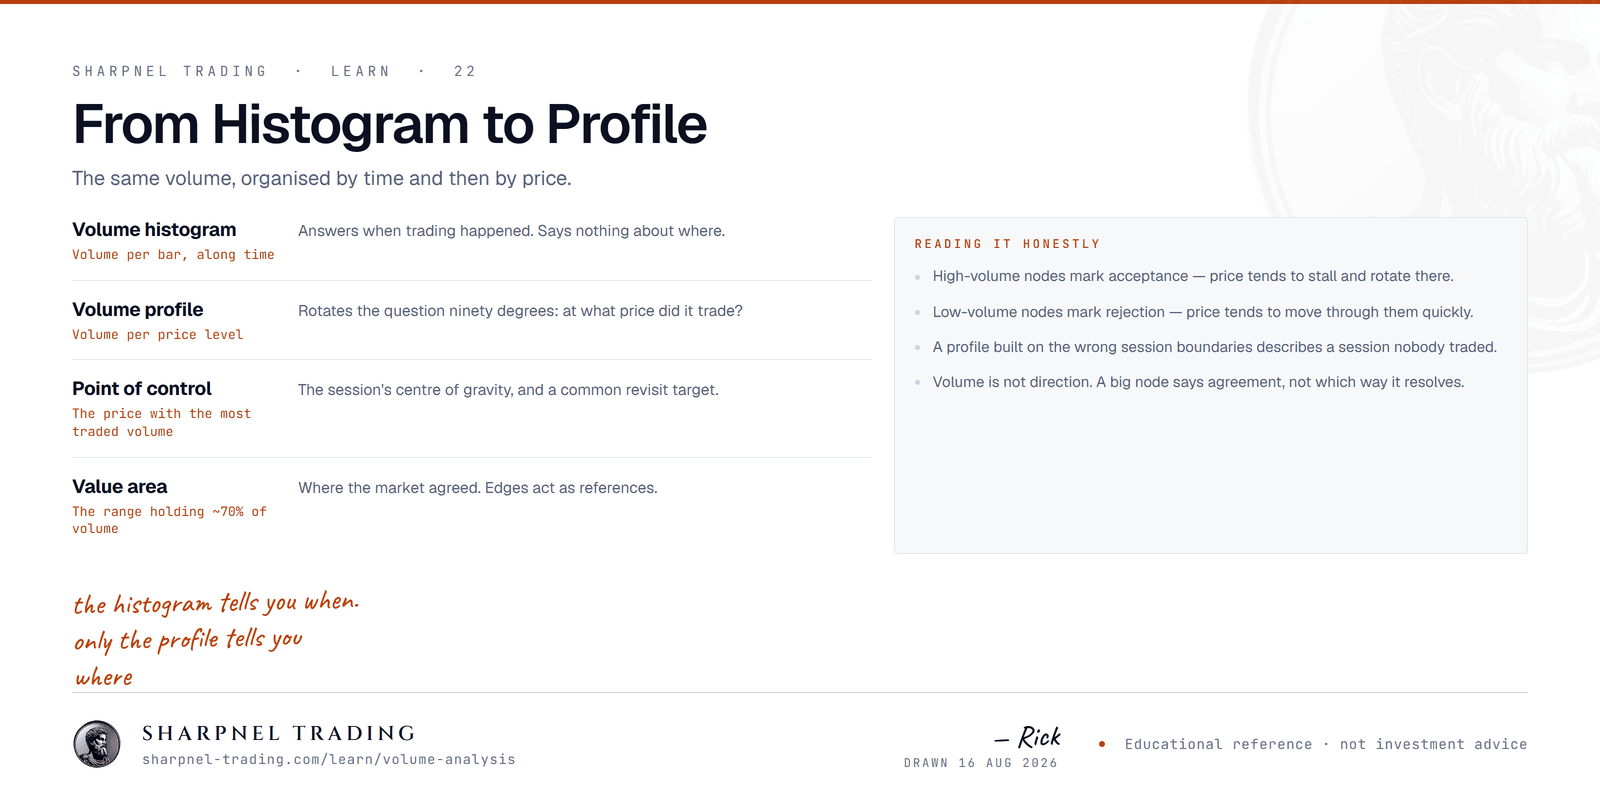
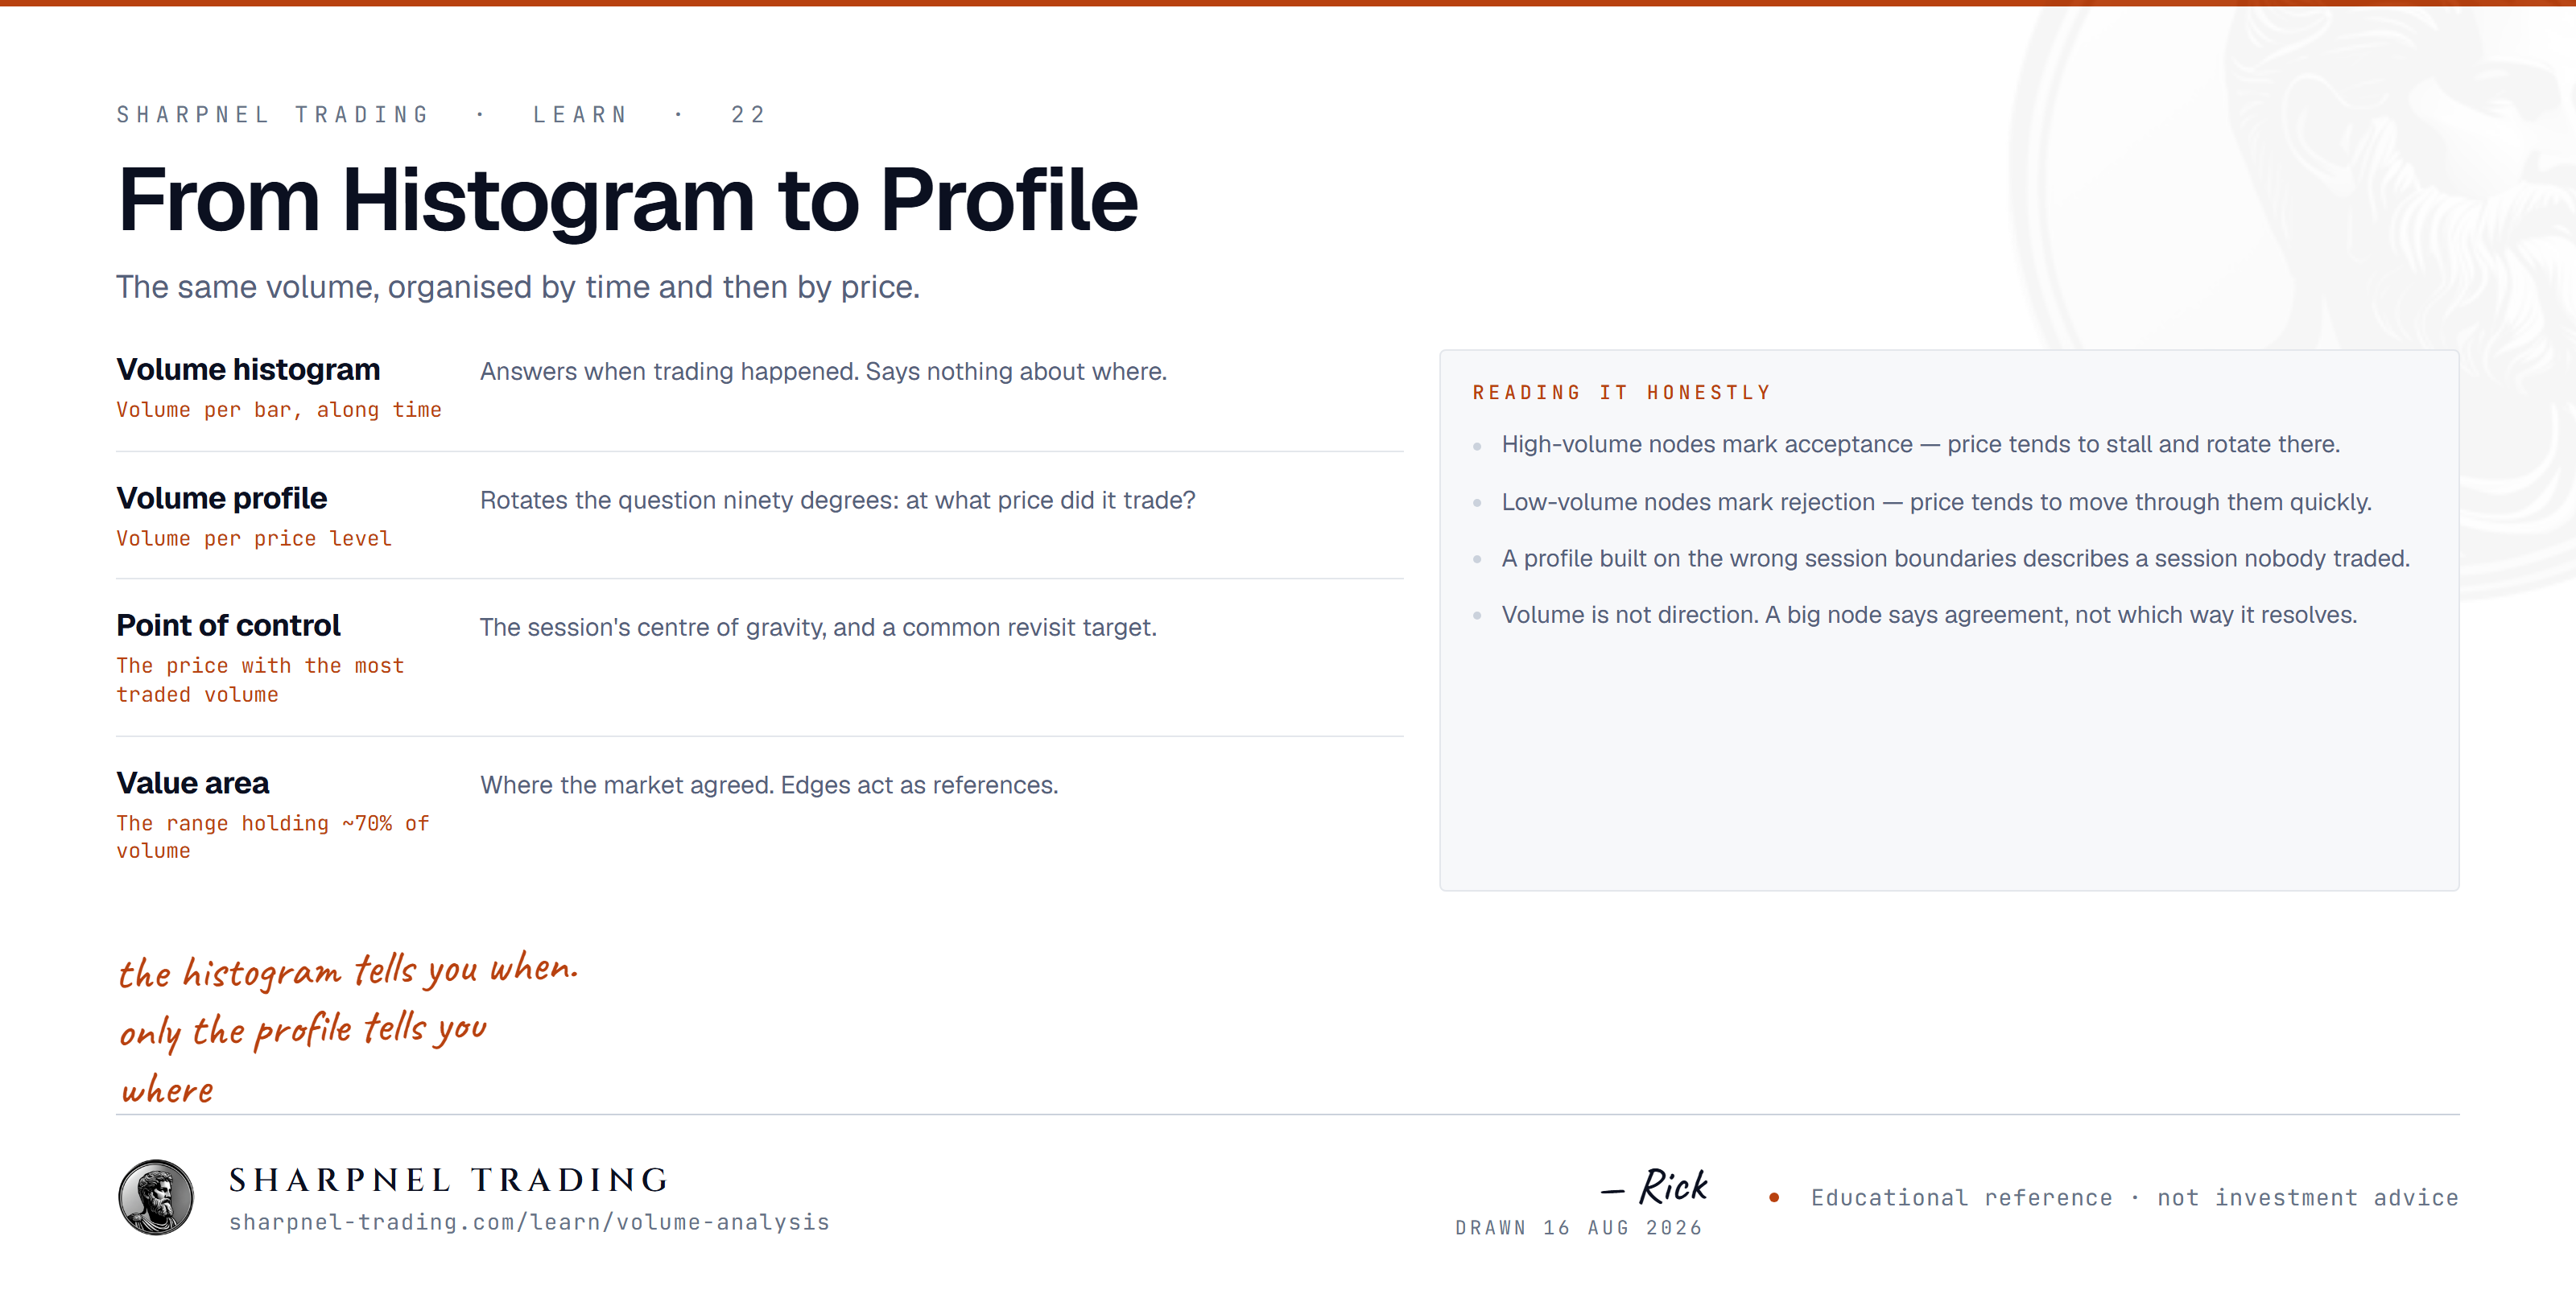
POC and the value area
Two reference levels fall out of any profile. The point of control (POC) is the single price with the most volume in the window. The value area is the band around it holding roughly 70% of the window's volume — a convention borrowed from the share of a normal distribution that sits within one standard deviation of the mean. The band's boundaries are the value area high (VAH) and value area low (VAL).
The honest way to think about the POC: it is the price where the most two-sided business was done, which makes it the market's best recent estimate of fair value. Price returns to it often — not because the level is magnetic, but because a fair price is where both sides remain willing to transact. Untouched POCs from prior sessions ("naked" POCs) stay relevant for days for the same reason: they mark old consensus the market never retested.
Profile shape adds a layer. A bell-shaped session says balance — the auction found a fair zone and rotated around it. A double-distribution session, two bells separated by a thin ledge, says the market repriced mid-session; that thin ledge is the level to watch, because almost no business was done there and movement back through it tends to be fast. Low-volume nodes behave this way: neither side found those prices worth trading the first time, so the market tends to traverse them quickly the second time.
The window matters as much as the shape. A session profile frames intraday rotation; a twenty-day composite frames the swing. A level that appears in both carries more weight than a level that appears in either alone.
The classic play built on these references: when price opens outside yesterday's value area and then gets accepted back inside, target rotation across the area toward the opposite extreme. When price opens inside value, expect responsive trade between VAH and VAL until one boundary is taken and held. What loses is well documented by everyone who has traded this: trend days. On a genuine trend day the market opens outside value, never re-enters, and runs over every value-area fade in sequence. Profile levels locate trades; they do not predict. If you trade the rotation, the failure point is defined for you — acceptance back outside the area kills the idea, and the loss has to be taken there rather than renegotiated.
I mark the prior session's POC and value area on ES before every open. Not as signals — as the frame that tells me whether today is negotiating with yesterday's business or ignoring it.
Absorption vs initiative volume
A futures trade prints when an aggressive order — a market order, or a limit priced across the spread — meets a resting passive order. Tools that split volume by aggressor side let you ask who initiated: volume trading at the ask is counted as buyer-initiated, volume at the bid as seller-initiated, and the running difference is cumulative delta.
Initiative volume is effort with result. Aggressors lift offers and price makes progress; the profile builds higher behind the move. From the inside, a healthy breakout looks exactly like this — directional delta and price advancing together.
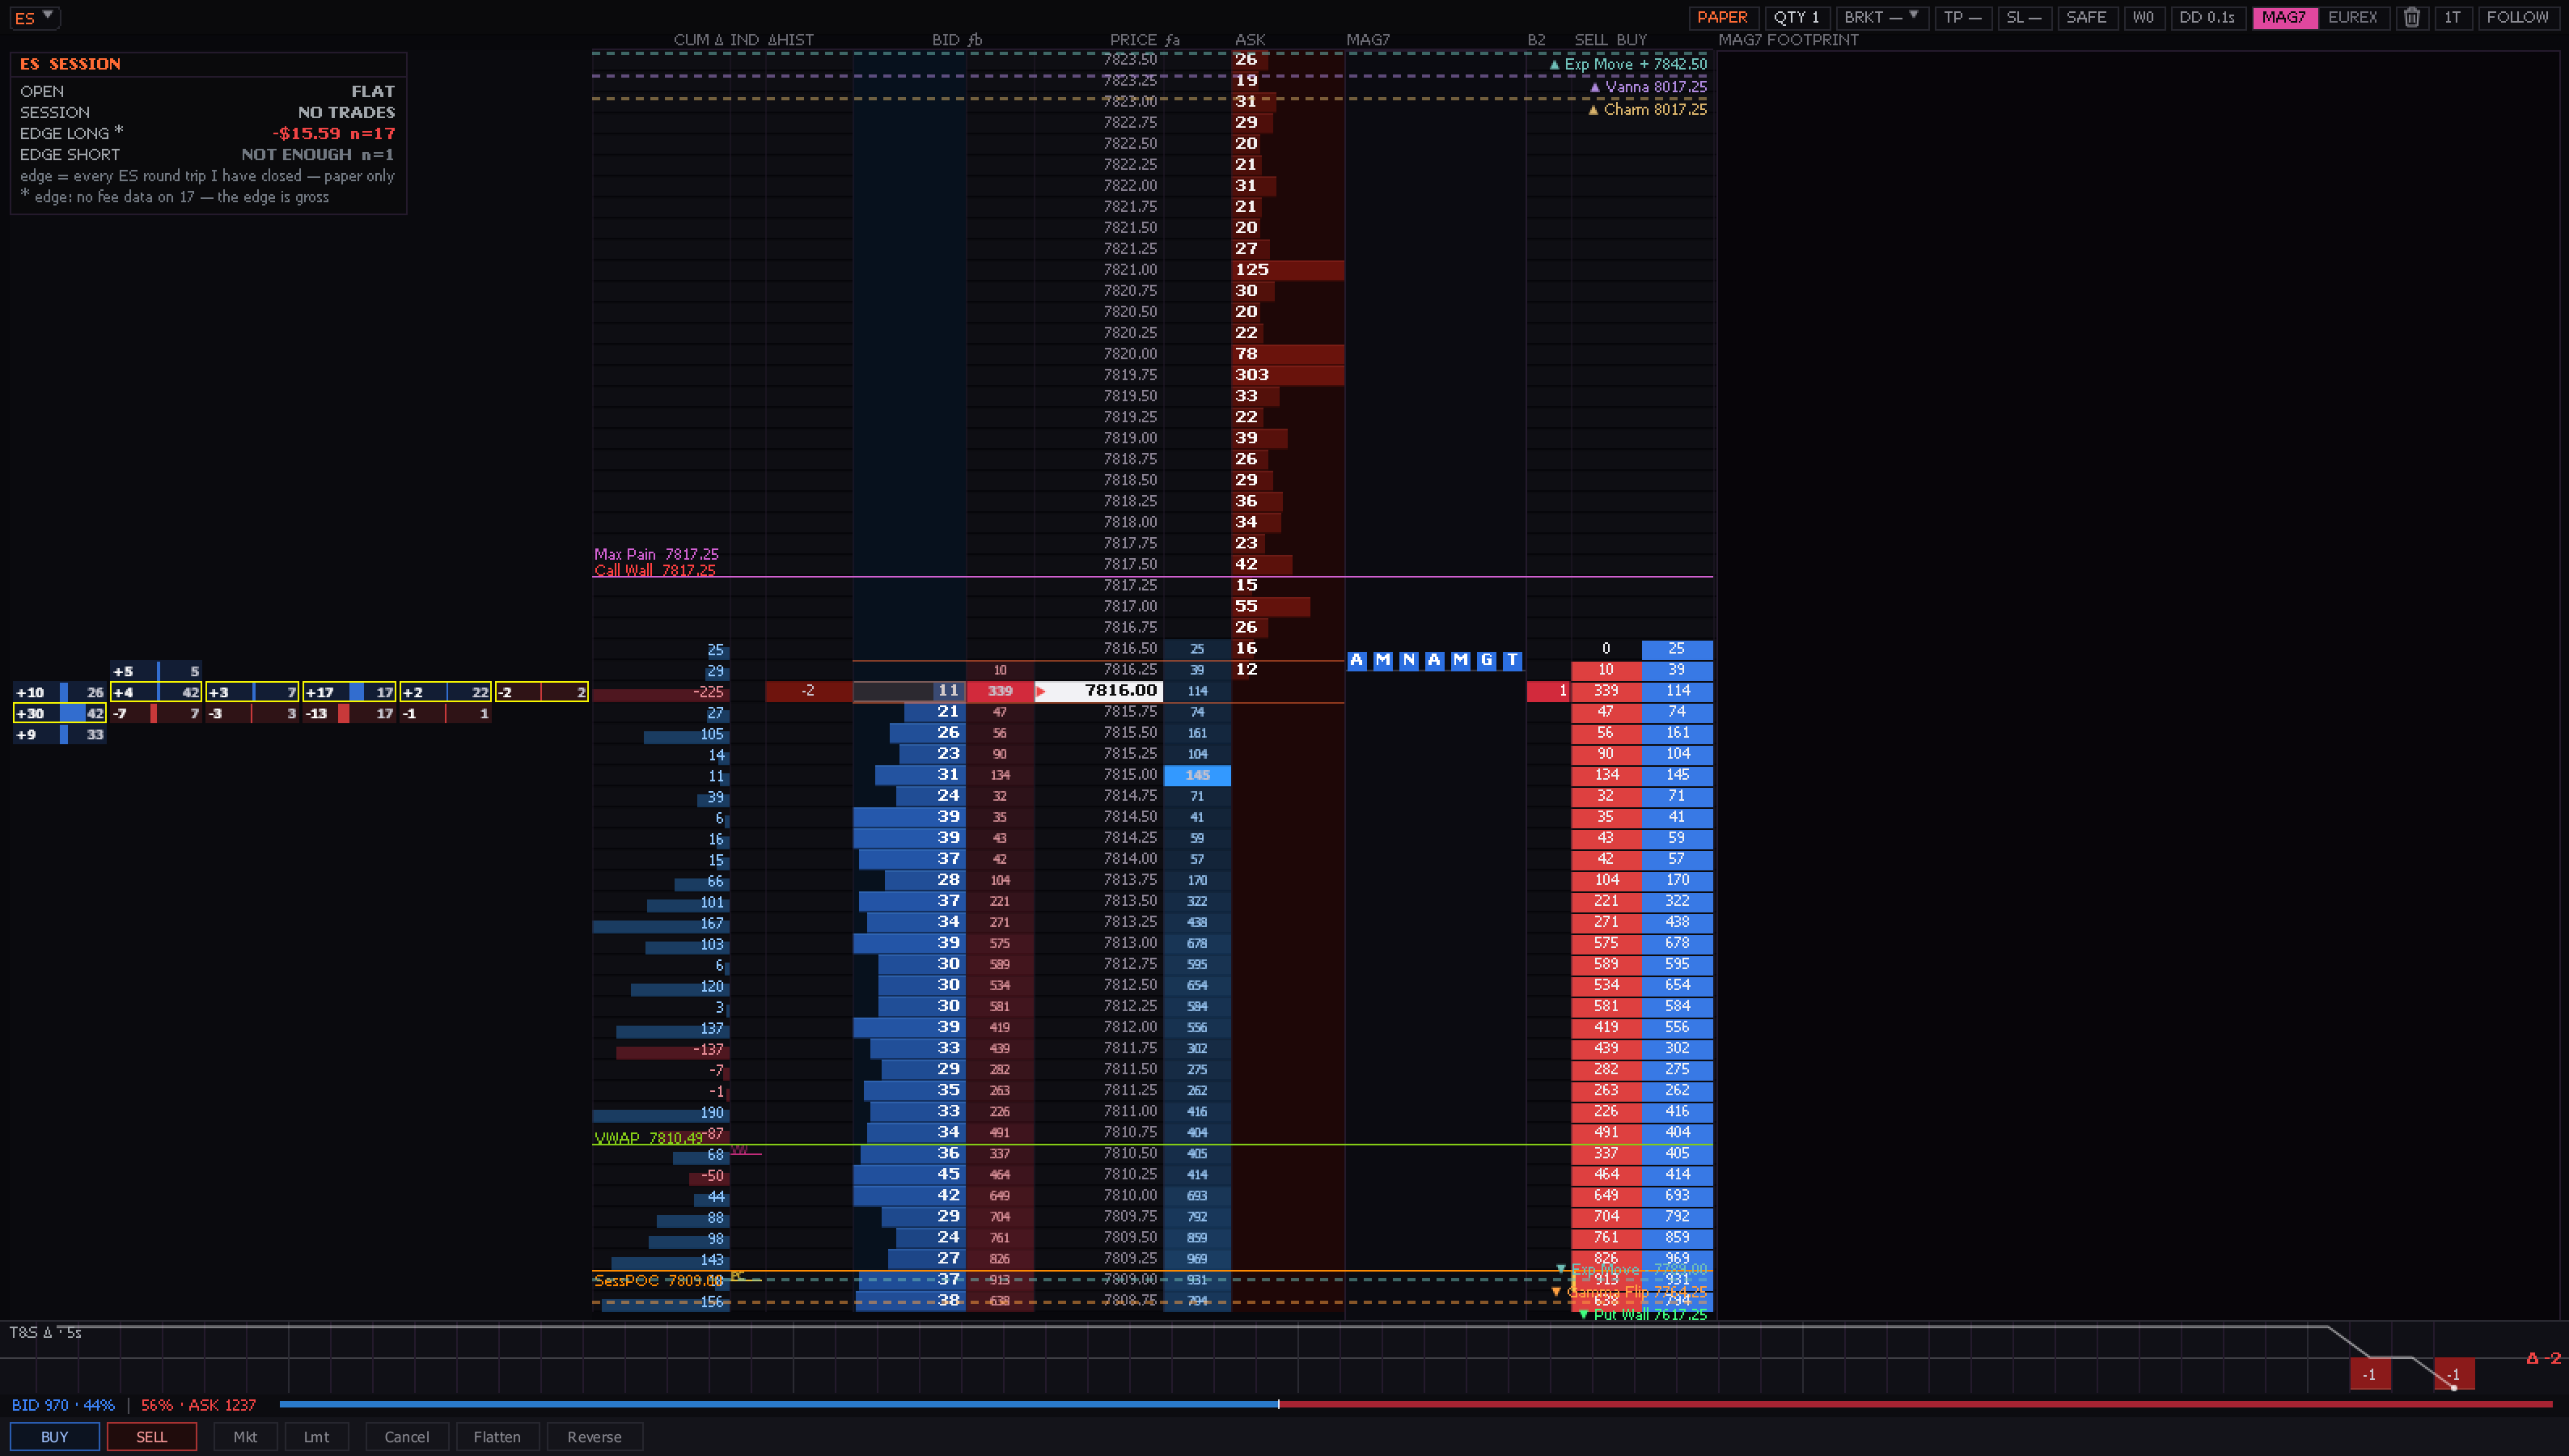
Absorption is effort without result. Say sellers hit the bid at 5,600.00 for 9,000 contracts over five minutes while price holds a three-tick range. If the bid never breaks, someone bought all 9,000 of those contracts passively — and heavy aggressive selling that cannot move price a single handle is information. On the depth of market this often shows up as a bid that keeps refilling at one price: the visible size never grows, but it never dies either. Confirmation arrives afterward, when price lifts away from the level as trapped sellers cover.
Absorption is also the easiest order-flow read to get wrong in real time. What looks like a passive buyer defending a level is sometimes a pause before that buyer pulls and the level collapses — and you find out which one it was only after the fact. Icebergs finish; refills stop without notice. A workable rule: absorption is context for a trade with a hard stop just beyond the absorbing level, never a reason to hold through the level's failure. When the absorbed side finally wins — and heavy absorption sometimes precedes exactly that — the exit from the range is fast, because the passive player who held the line has stepped away.
Divergences: effort against result
Divergences generalize the absorption idea from a single level to a swing.
The time-axis version: price makes a new session high while per-bar volume contracts. Participation is thinning — fewer contracts are willing to do business at the new prices. Context decides whether that matters. At a prior reference during regular hours — yesterday's high, the top of a composite profile — thinning volume into the level deserves attention. In quiet hours it is close to meaningless: the overnight session trades a small fraction of day-session volume and drifts to new extremes on thin trade routinely.
The delta version is sharper: price makes a higher high while cumulative delta makes a lower high. Net aggressive buying did not produce the new high — often it is short covering, or passive bids working price upward while sellers stand aside. The mirror image applies at lows.
The failure mode of divergence trading is impatience dressed as analysis. Nothing forces a divergence to resolve as a reversal. Strong trends print delta divergences for hours while grinding on, and fading each one means paying repeatedly to be early. A divergence downgrades the quality of a move; it does not start a countdown on the move's end. Used well, it argues for tightening risk on with-trend positions, or for demanding a confirmed failure — a lower high, a lost level — before positioning against the move. Used as a standalone trigger, its losses cluster in exactly the environments that trend hardest.
A session routine that uses all four ideas
- Before the open, mark the prior session's POC and value area boundaries, plus any naked POCs within reach.
- At the open, classify price against value. Inside the area, rotation between the boundaries is the base case. Outside it, acceptance argues continuation and rejection sets up the trade back across.
- At each reference, read the tape both ways — is volume expanding through the level, which favors continuation, or is heavy volume failing to move price, which suggests absorption?
- Track cumulative delta against price at every new extreme, treating divergence as a reason to demand more evidence rather than as the evidence itself.
None of this removes the need for a defined risk point on every position; volume tools narrow
where to act while doing nothing about the fact that any single read can be wrong. What they offer instead is an honest record. Indicators are transformations of price. Volume at price is a ledger of business actually done, written by participants who paid to be there — and reading that ledger well is the closest a screen trader gets to standing in the pit.