Bid/ask volume inside every candle. Imbalance coloring.
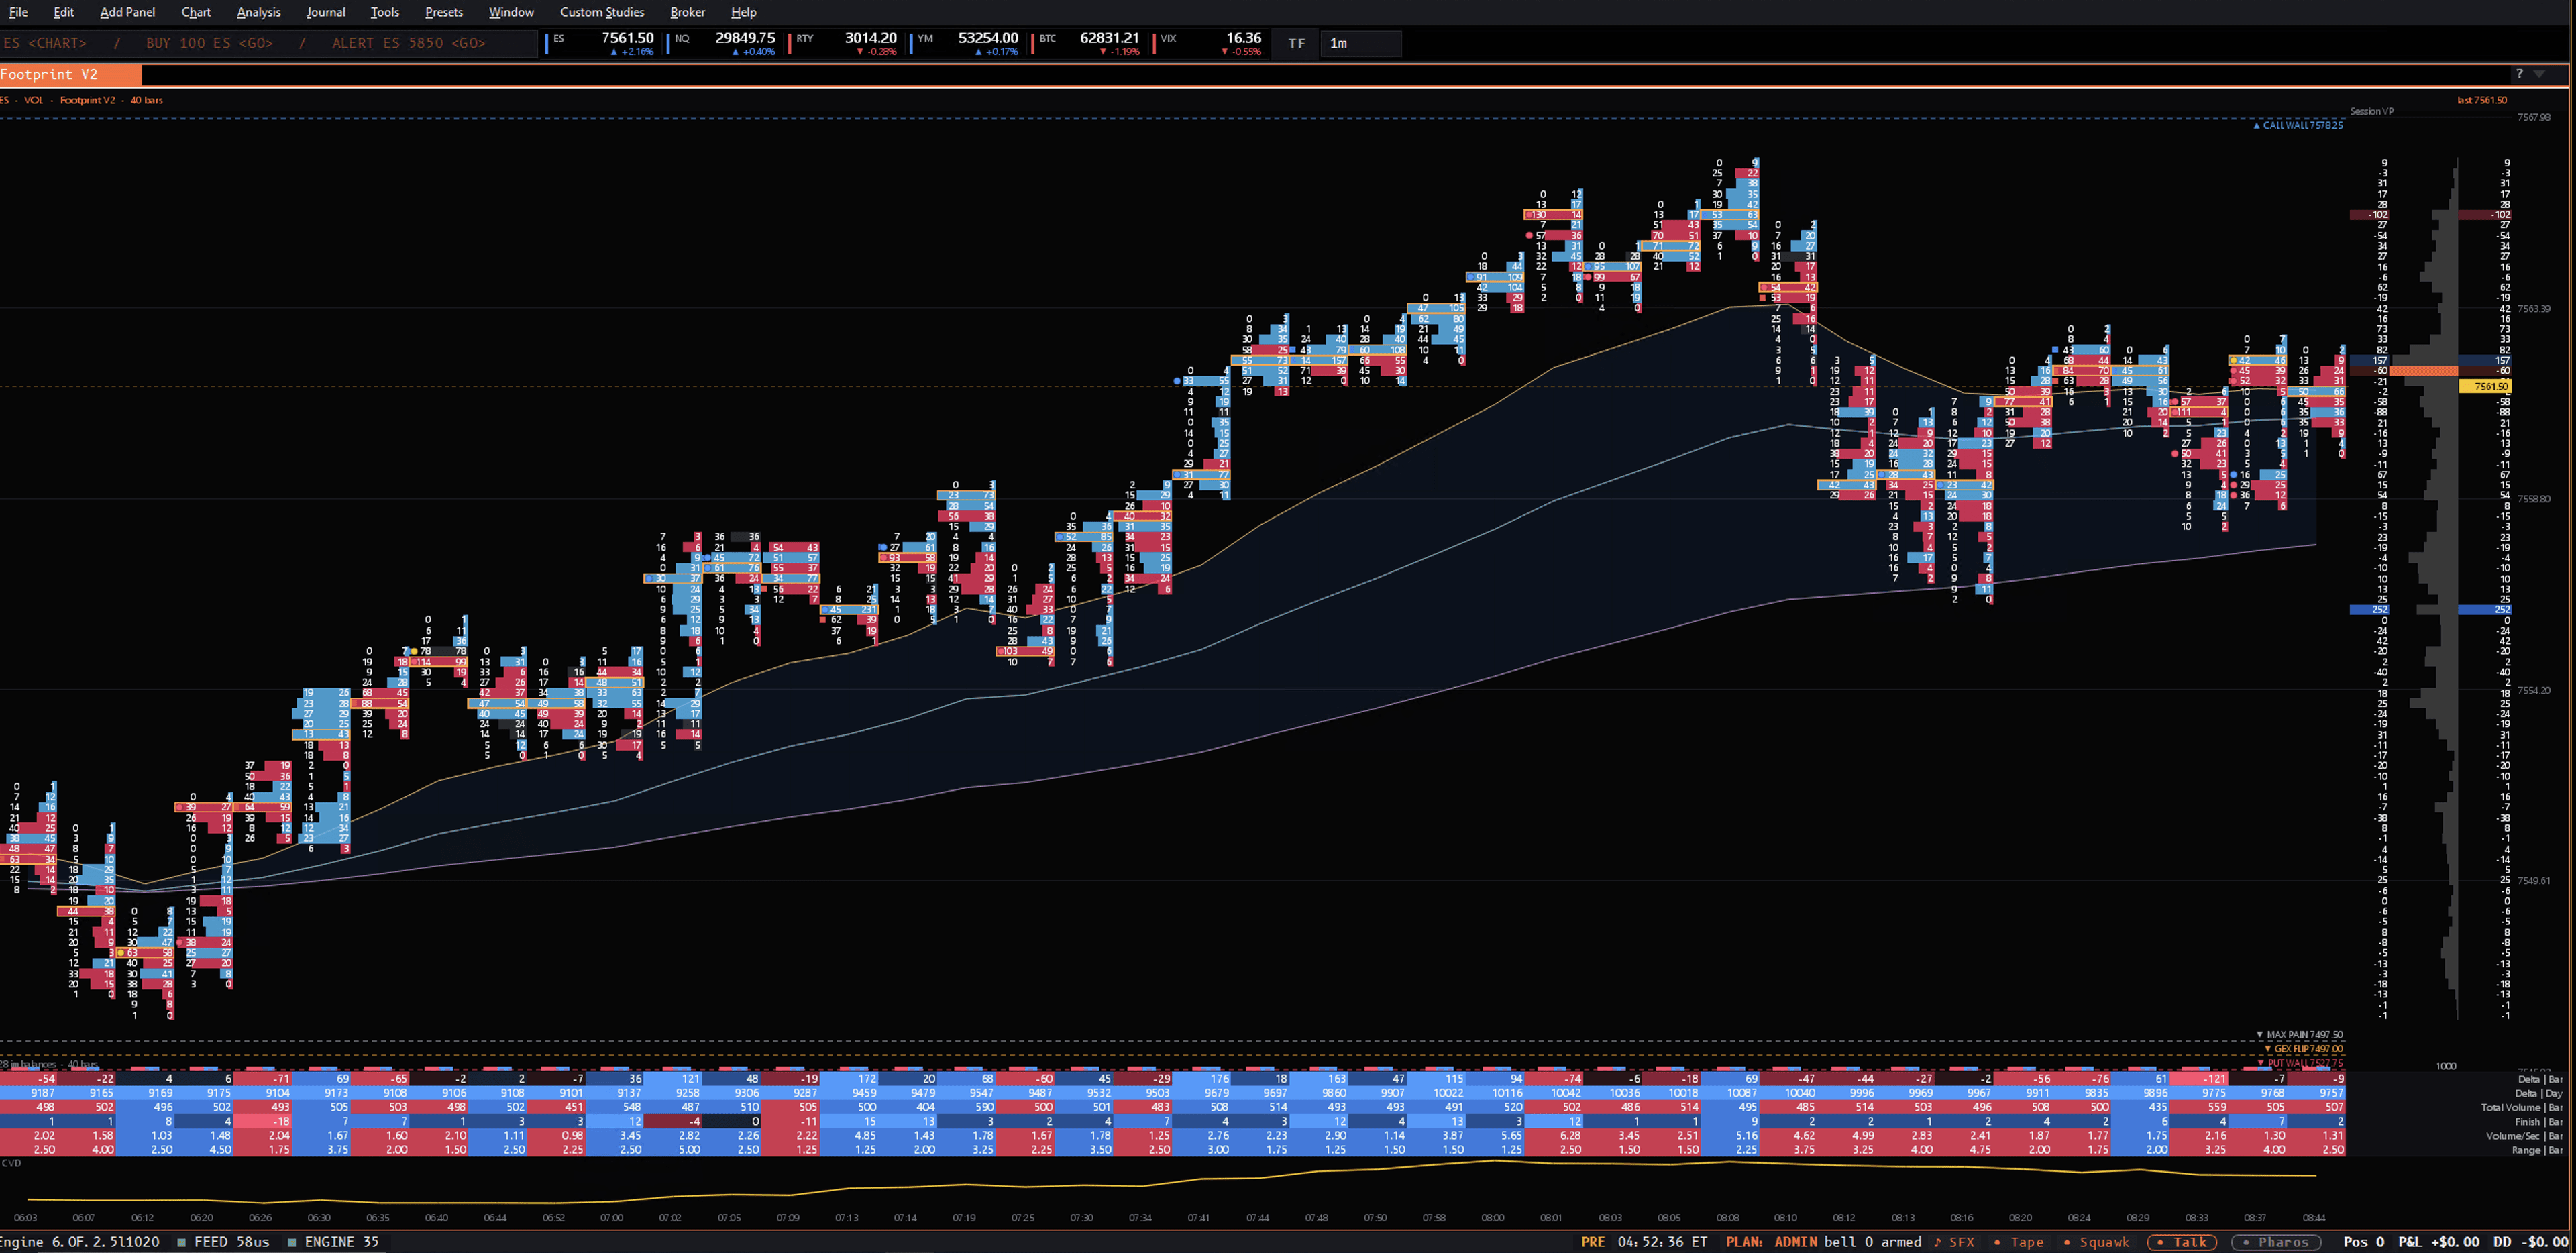
“The footprint breaks each bar open to show traded volume at every price, split buy side and sell side.”
Each candle is split into rows — one per price level — with bid volume on the left and ask volume on the right. Color intensity reflects relative size inside that bar. Imbalance coloring flags cells where one side heavily dominated.
Where a regular candle tells you open, high, low, close, a footprint tells you how it got there — whether buyers or sellers were aggressive, and at exactly which prices.
Per-bar bid/ask volume profile with delta + imbalance.
Open itAdd Panel ▸ Order Flow ▸ Footprint (Per-bar volume profile)
Inside every bar, prices stack vertically. Each price level shows two numbers: bid-side volume (left, magenta) and ask-side volume (right, cyan). The profile inside the bar tells you WHO traded WHERE within the bar's range.
Bottom of each bar shows the delta (cum_buy - cum_sell). Positive delta + green close = confirmed buy-side aggression. Positive delta + red close = absorption (buyers couldn't lift price; sellers absorbed).
When ask-side volume exceeds bid-side volume by 3×+ at a level (or vice versa), that price is highlighted. Stacked imbalances on the same side at consecutive bars = directional conviction; opposing-side imbalance after a run = reversal signal.
Cycle the mode chip in the panel header: VOLUME / DELTA / DELTA-PROFILE / BID-ASK / IMBALANCE / etc. Each surfaces a different per-bar question. Volume = where; Delta = who; Imbalance = aggression-side.
Type DOM. The footprint shows what was TRADED at each price; the DOM shows what's RESTING right now. Combined: "big footprint imbalance at 4500 + still 5000 contracts resting" = level hasn't been used up.
Ctrl+P, then # and the panel name.ES FP or NVDA FOOTPRINT — opens it on that symbol.Every bar column spans that bar's full price range. Each price-level cell splits into two: the buy-aggressor (ask-lifting) volume as a cyan bar on the right, the sell-aggressor (bid-hitting) volume as a salmon bar on the left. Where the cell is wide enough, the raw numbers print inside it. Bar length — not saturation — carries the size, so the eye reads magnitude at a glance across the whole grid.
Each bar's Point of Control — the price row with the most traded volume — is marked with an orange dot. Watching the POC dot shift bar-over-bar is the quickest read on where the auction's center of gravity is migrating.
Cells where one side traded at least 3× the other pick up an orange border — the diagonal, stacked imbalance patterns that mark one-sided aggression become obvious without hunting through the numbers. Several lopsided rows lined up at consecutive prices is a stacked imbalance.
Under the grid, each bar carries a delta footer — its net buy-minus-sell aggressor volume. A cumulative delta (CVD) line runs across the panel on top of that. The classic read is the divergence: price making a new high while the CVD line fails to confirm is the tell this line exists for. Both the footer and the CVD line develop live inside the forming bar as prints arrive, so the current bar is never a frame behind the tape.
The real dealer-gamma walls — Call Wall, Put Wall, Gamma Flip, and the rest — draw straight across the cells as labeled horizontal lines (the same GEX levels the chart and DOM carry), on by default. A yellow live-price line marks the current trade across every bar. Walls that sit outside the visible price range clamp to a top or bottom edge marker so a far level is never silently dropped.
AWAITING TICK DATA rather than substituting a synthetic distribution — an honest blank instead of a made-up footprint.