OLS regression vs SPY — beta, alpha, R² across 60/120/252-day windows.
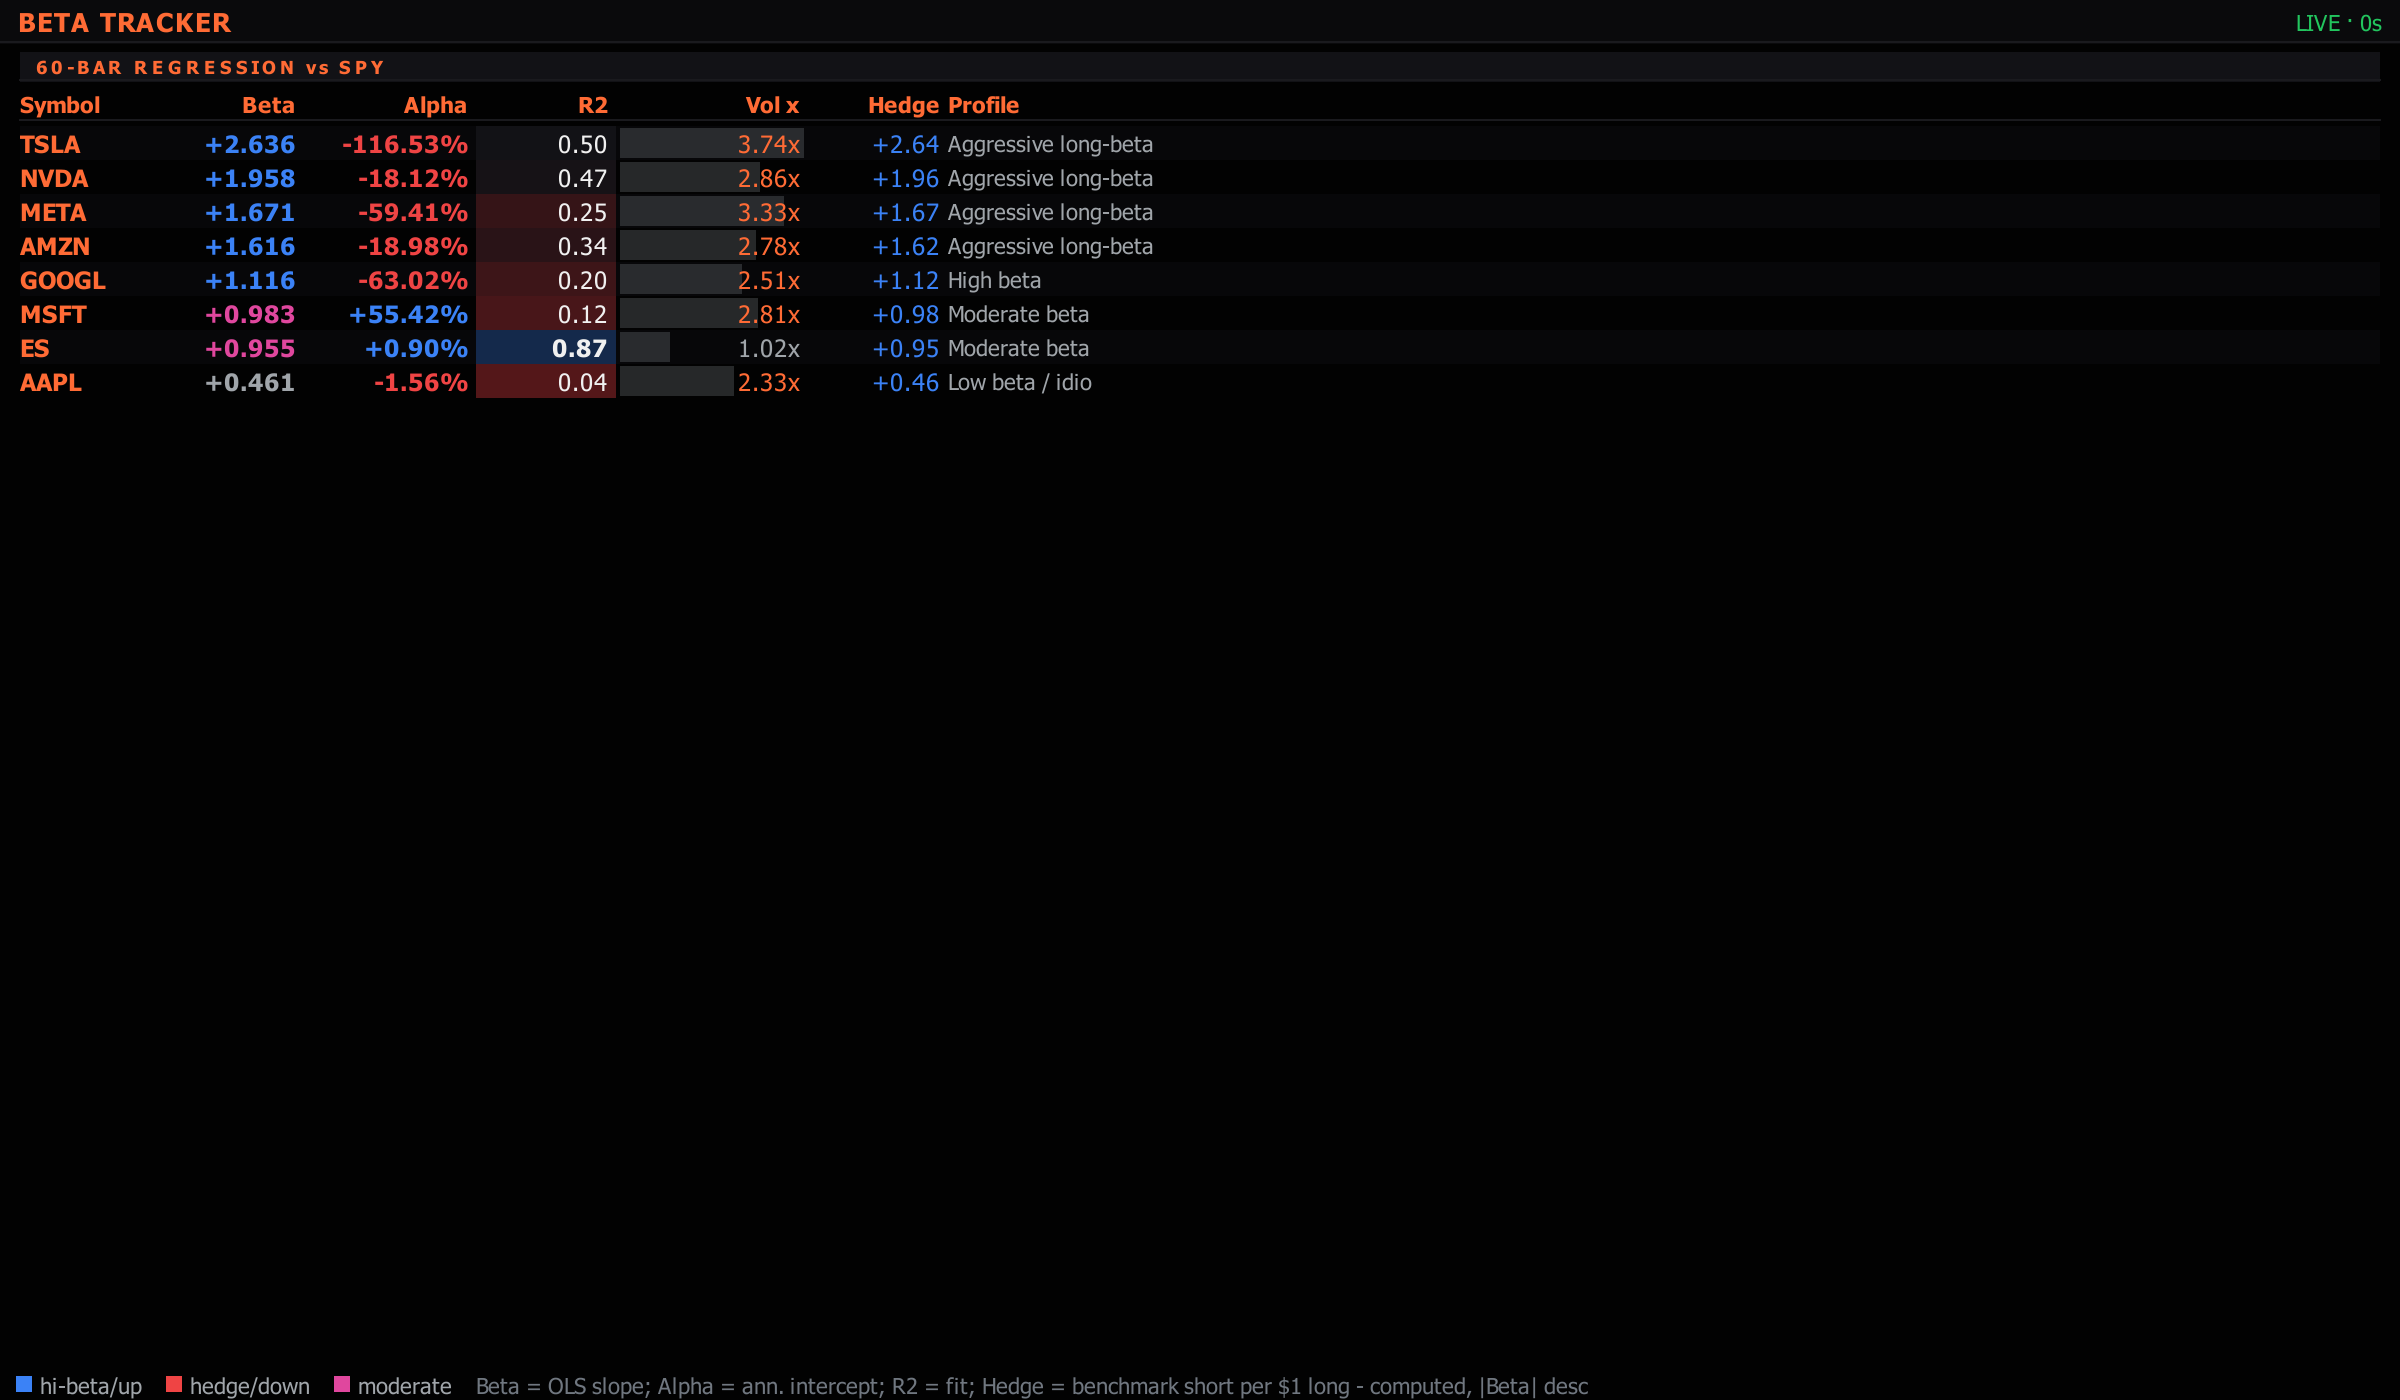
“The beta tracker runs a rolling regression of each name against the market, reporting beta, alpha and fit.”
OLS regression of the focused symbol's daily returns against SPY. Reports beta, alpha, and R² across three fixed windows: 60-day, 120-day, and 252-day. A rolling-60-day beta line chart tracks how sensitivity to the market has shifted over time.
Beta color-flips at clear thresholds: Spark above 1.2 (aggressive), muted below 0.8 (defensive). Alpha is annualized.
Symbol-scoped β / α / R² vs benchmark.
Open itAdd Panel ▸ Macro ▸ Equities & Breadth ▸ Beta Tracker (vs SPY)
Beta is window-dependent. Short-window beta captures recent regime; long-window beta smooths through cycles. Compare across windows: 60d > 252d = beta is rising (the stock is getting more market-sensitive).
Alpha = excess return after stripping out beta-explained moves. R² = how much of the stock's variance is explained by the benchmark. R² > 0.7 = beta is meaningful; < 0.3 = beta is a poor fit, idiosyncratic risk dominates.
Lower strip plots beta as a time series. Trending up = beta rotation (e.g. defensive name turning cyclical). Spike + revert = event-driven outlier in the regression window.
Benchmark defaults to SPY (S&P 500 ETF). Click to swap to IWM (Russell 2000), QQQ (Nasdaq-100), or sector ETFs. Different benchmarks give different betas — high tech-name vs QQQ < 1.0 can be > 1.5 vs SPY.
Ctrl+P, then # and the panel name.Ctrl+P, then @ and the ticker — the panel follows its link group.Divergence across windows is informative — if 60-day is 1.5 and 252-day is 0.9, the stock has recently re-correlated to the market after a quieter year.
