Valuation, margins, growth, balance-sheet snapshot for any equity.
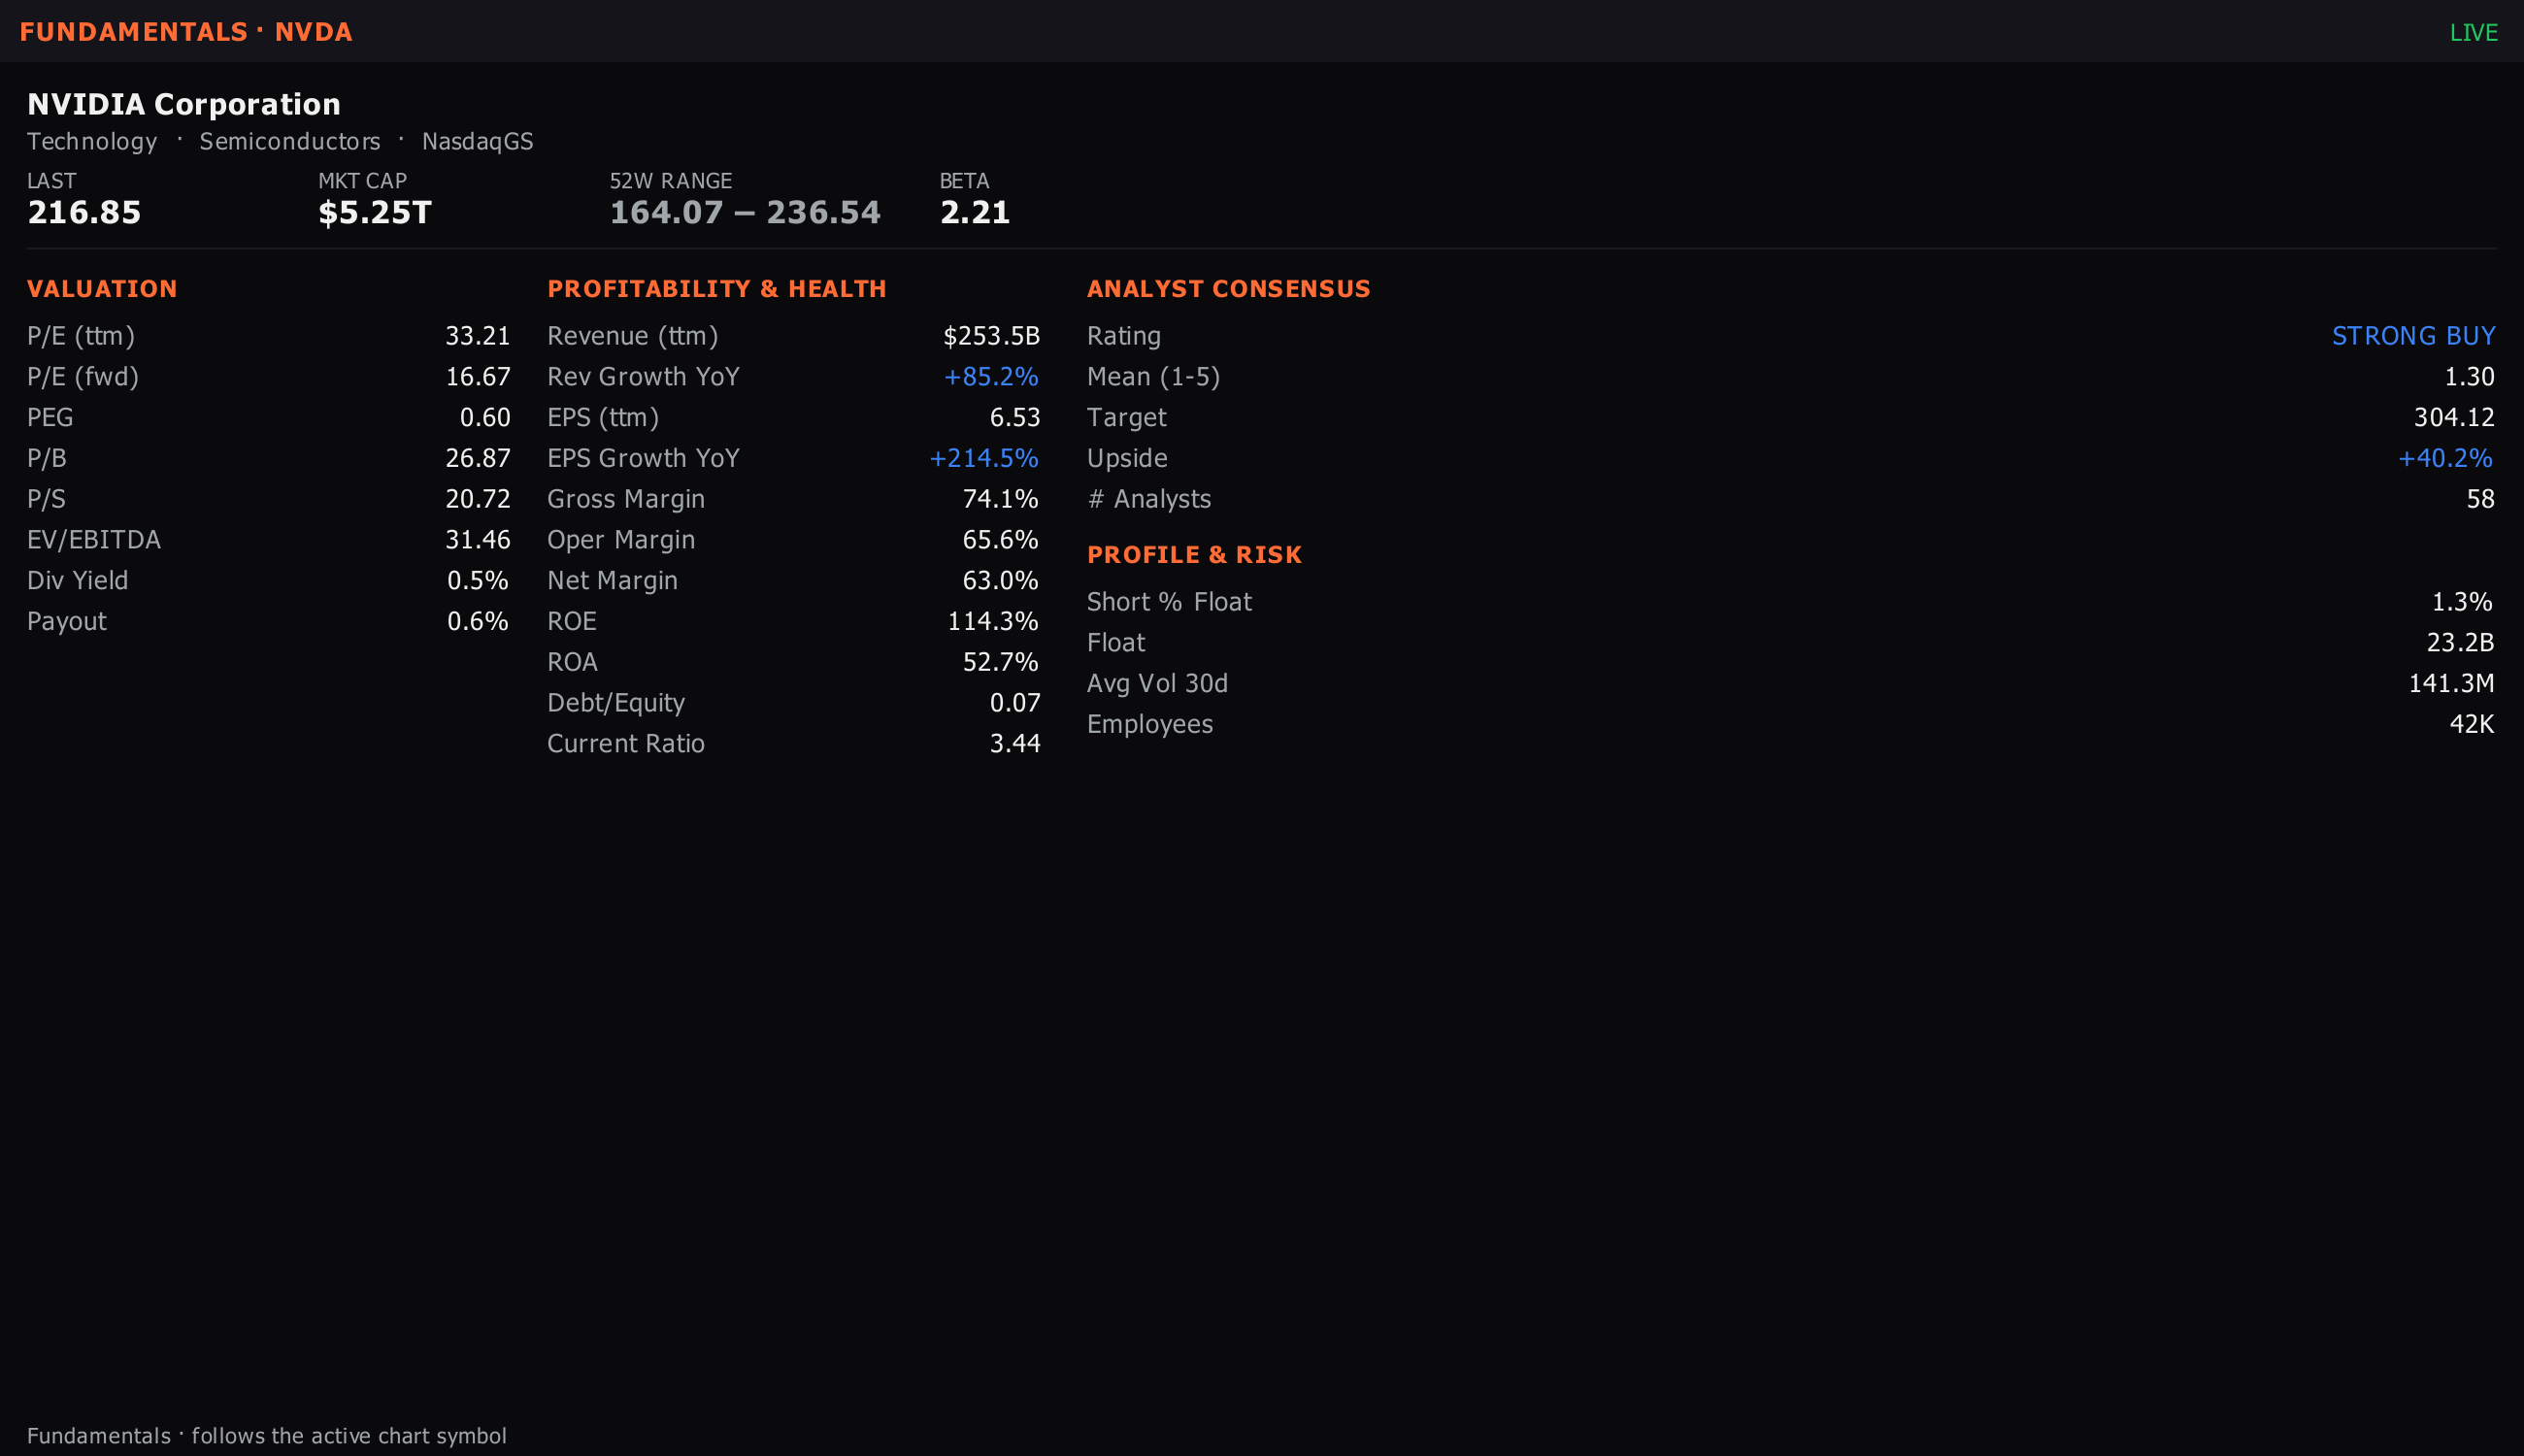
“The fundamentals panel shows a company's reported figures: valuation ratios, profitability, revenue and earnings.”
Current fundamentals for the focused equity: valuation multiples, margin and return ratios, revenue growth, balance- sheet items, dividend yield, industry, listing exchange. An equity-research first stop.
Valuation + profitability + growth + consensus on one screen.
Open itAdd Panel ▸ Stocks ▸ Fundamentals (FA/DES — follows symbol)
Market cap, P/E (trailing + forward), EV/EBITDA, price-to-sales, price-to-book. Compare against sector medians visible on the same row to spot relative-value setups.
Gross / operating / net margins, ROE, ROIC. Revenue and EPS growth trailing-twelve-months and 5-year CAGR. Look for margin expansion alongside revenue growth — quality + scale.
Street recommendation + price-target summary. BUY/HOLD/SELL distribution + average target price vs current. Wide target dispersion = analyst disagreement = volatility opportunity.
Type GF to open Graph Fundamentals — same metrics as 2x2 grid trend charts across 8 trailing quarters. The static numbers here become a trajectory there.
Ctrl+P, then # and the panel name.Ctrl+P, then @ and the ticker — the panel follows its link group.The eight-quarter trend on revenue, EPS, net margin and free cash flow is the graph tab on this same panel. The table is the snapshot; the graph tab is the trajectory.
