How the hedge works, with arithmetic
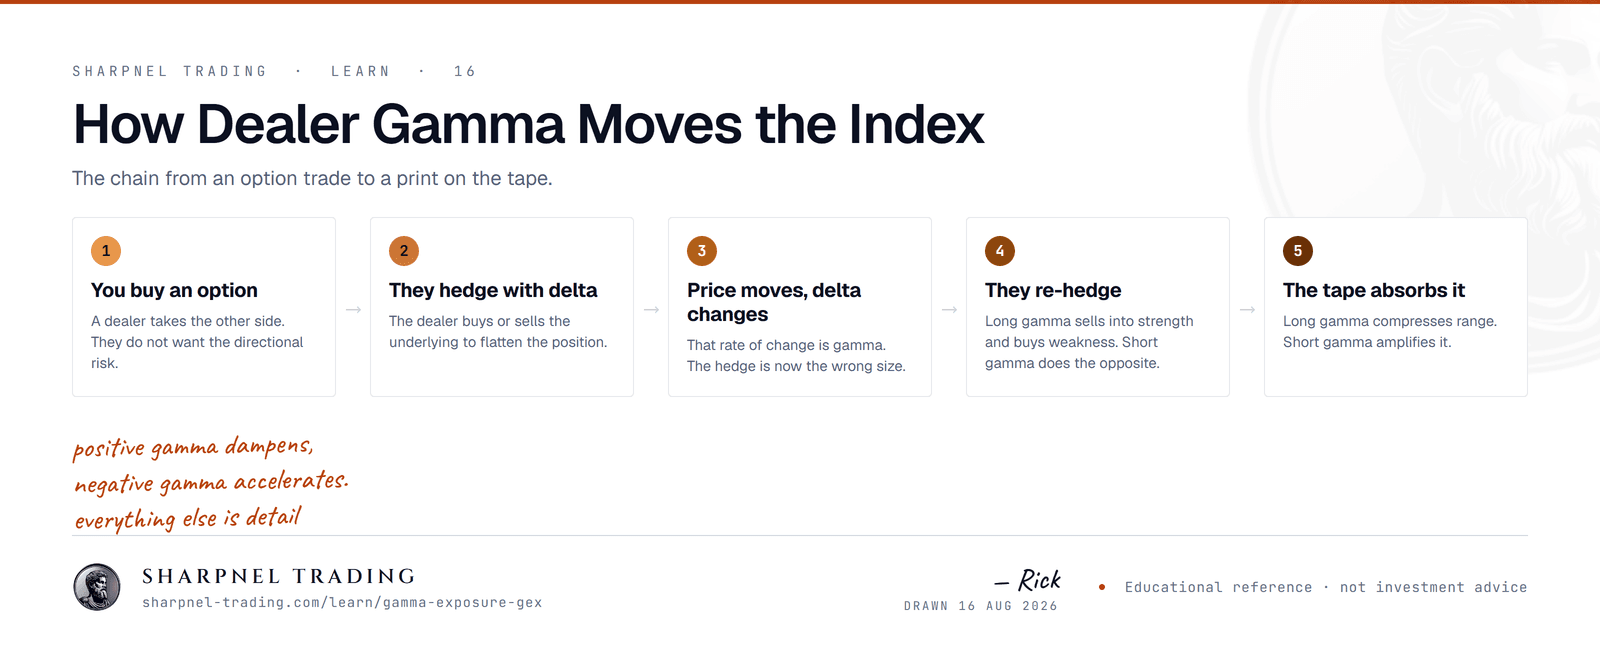
A hypothetical makes the mechanics concrete. Say SPX trades at 5,600 and a dealer is long 1,000 calls at the 5,600 strike, each carrying a delta of 0.50 and gamma of 0.002 per index point. With the $100 multiplier, the book's delta is 1,000 × 0.50 × 100 = 50,000 index-equivalent units, so the dealer runs a matching 50,000-unit short — often in ES futures or the cash basket, which is why futures traders feel these flows before anyone else.
Now the index rallies 25 points to 5,625. Each call's delta rises by 0.002 × 25 = 0.05, to 0.55, putting the book at 55,000 units of long delta against a 50,000-unit short. The dealer sells 5,000 more units into strength to get flat. Reverse it — a 25-point decline drops delta to 0.45 — and the dealer buys 5,000 units back into weakness. Long gamma turns the hedger into a systematic seller of rallies and buyer of dips. Spread across thousands of strikes, that is what a compressed, pinned tape is made of.
Short gamma inverts every flow. A dealer short those same 1,000 calls must buy 5,000 units after the identical rally and sell 5,000 after the identical decline — chasing strength and hitting bids into weakness, accelerating whatever the market was already doing. Same option, same strike, opposite regime.
Why walls act as support and resistance
A wall is the strike where one side's gamma concentration peaks.
The call wall sits above spot at the strike with the heaviest call gamma. Under the standard positioning template — funds overwriting calls against long stock, dealers on the other side — dealers are long those calls, and an option's gamma is greatest when spot is at the strike. As price climbs toward the wall, hedging supply intensifies point by point, which is why rallies so often stall and chop there instead of slicing through. Nothing is being defended; the wall is a gradient of obligatory selling that steepens into the strike.
The put wall is the mirror image with an honest asymmetry. Customers largely own downside puts, leaving dealers short them — short gamma below the market. On the way down toward the wall, dealer hedging adds selling pressure rather than absorbing it. The strike still tends to act as support for two reasons: gamma decays past the wall, so obligatory selling decelerates once the strike trades; and put owners tend to monetize protection there, and every put sold back lets a dealer buy in short futures hedges. That buy-back is real demand — until a session arrives when nobody monetizes. In a genuine risk-off cascade the wall breaks, and the same math that made it support makes the move through it faster.
The flip point
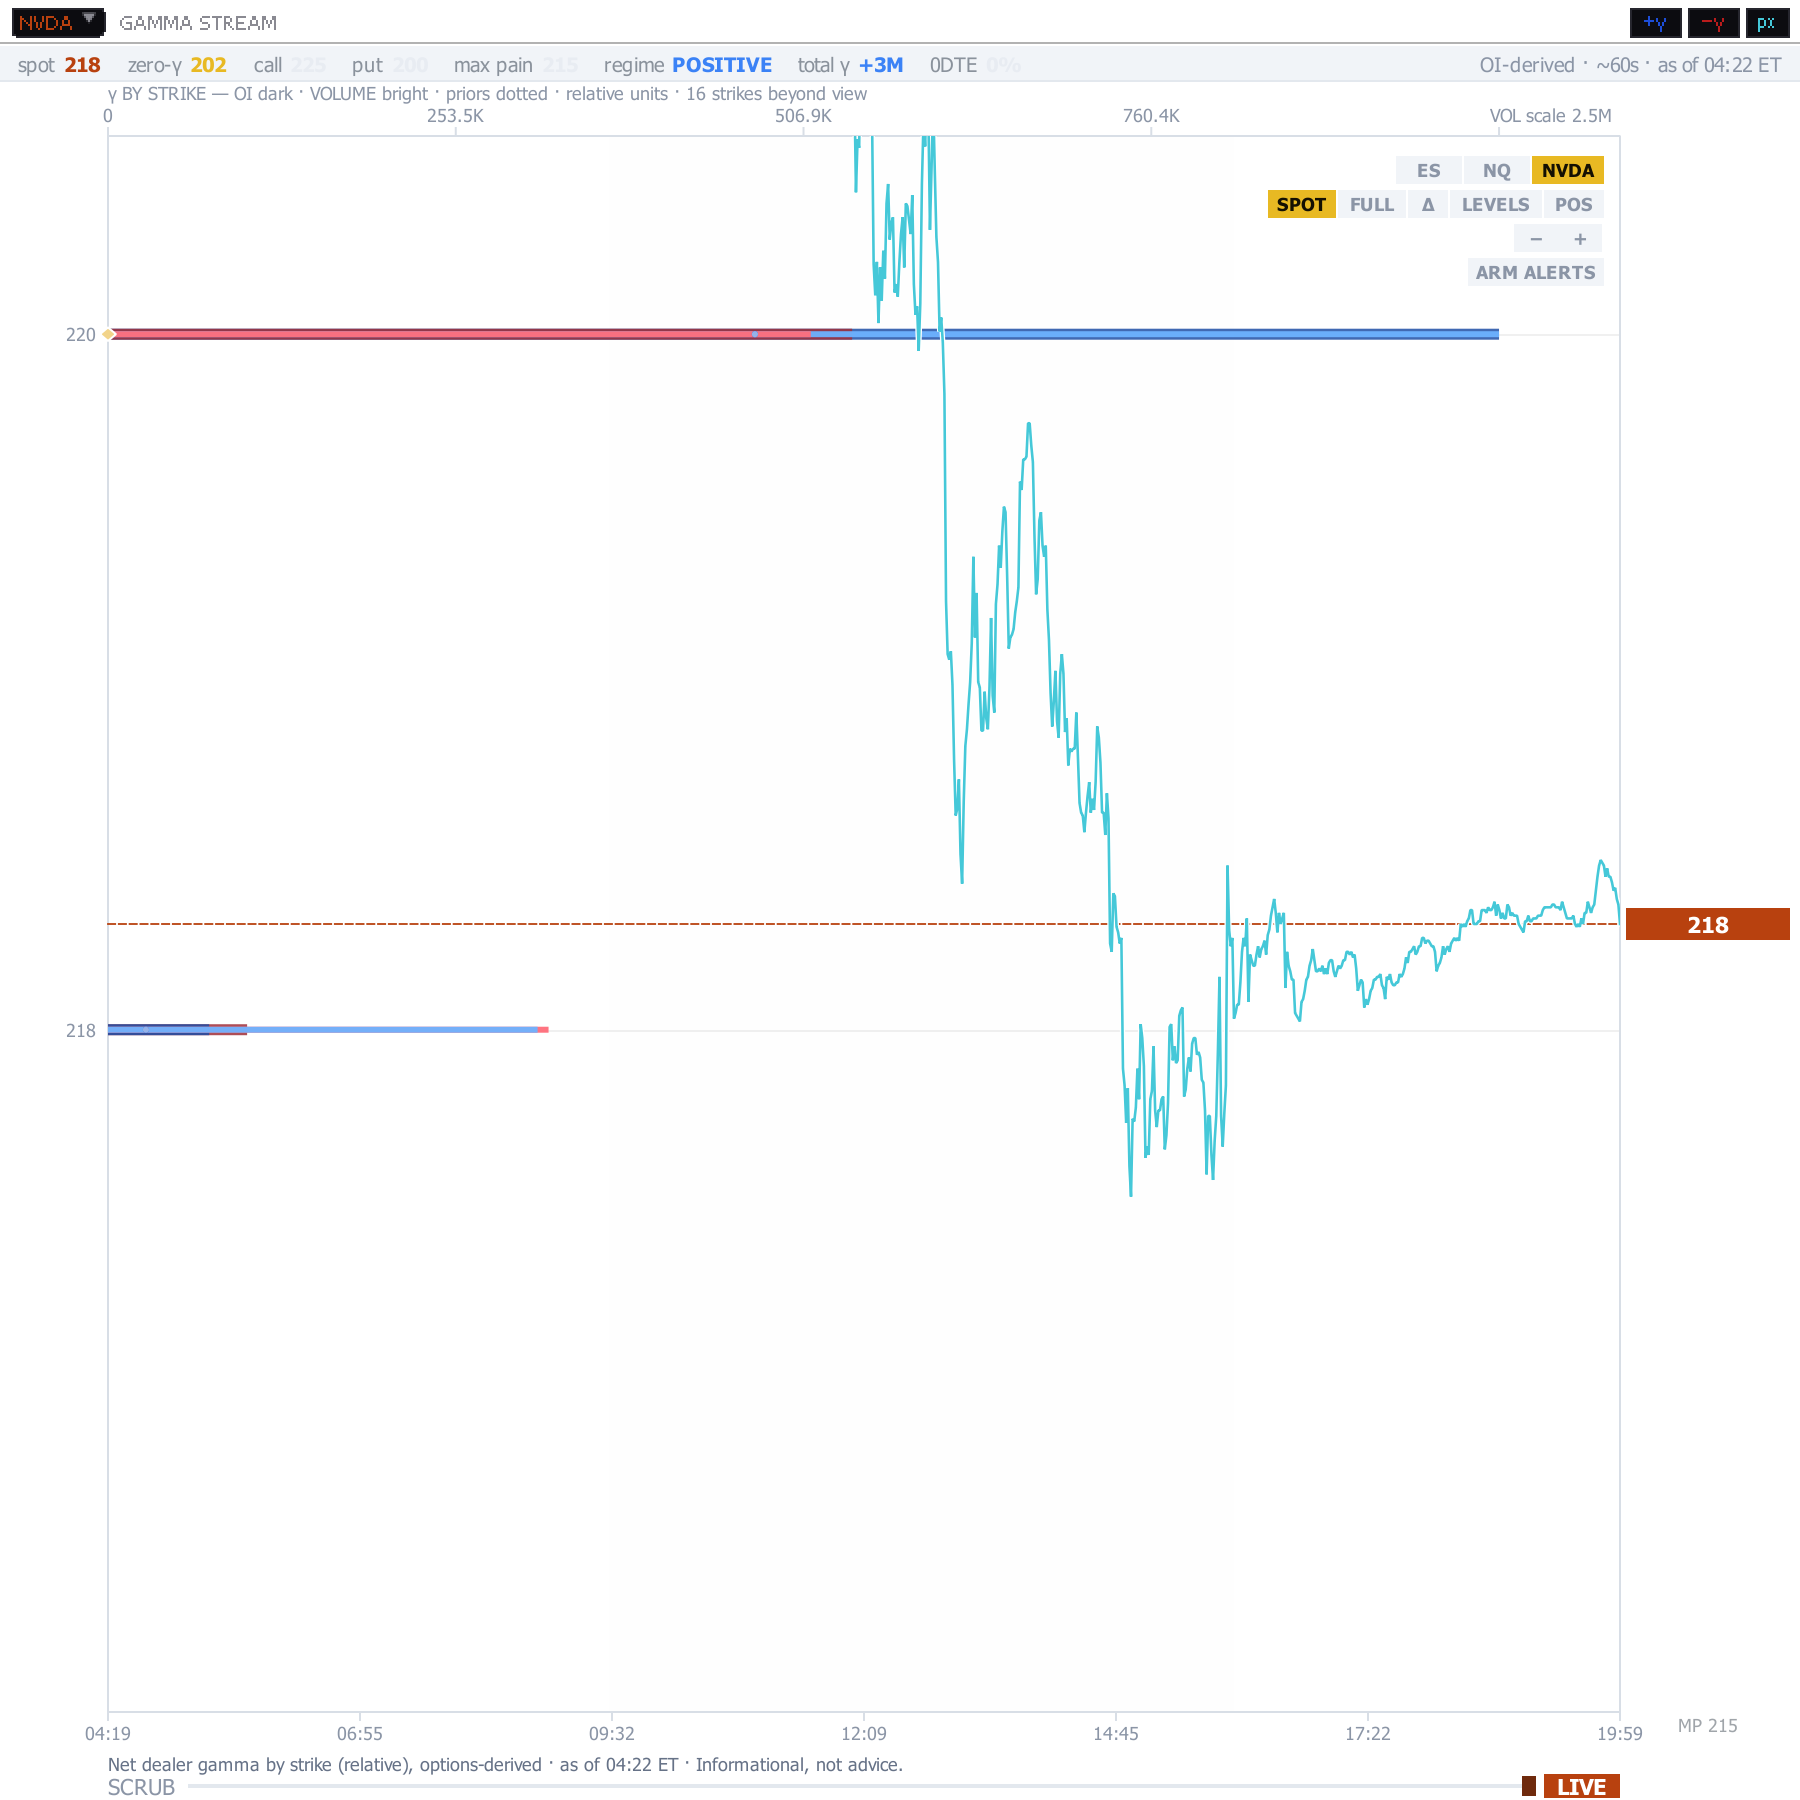
Sum the positive and negative gamma across the whole chain and there is a spot level where the net crosses zero. Above it, long-gamma hedging dominates: dips get bought mechanically and ranges compress. Below it, short-gamma hedging dominates: moves get chased and ranges expand. The flip is a regime boundary, not an entry signal. I track it on ES every session — it is among the levels published daily on /levels — and the change in tape character when the level is lost usually shows up within minutes, well before any indicator confirms it.
Distance matters as much as location. A market resting a few points above its flip is one headline away from a different volatility regime; a market far above it can absorb the same headline with a wobble.
What 0DTE does to all of this
Gamma is not evenly distributed across time. An at-the-money option's gamma grows as expiration nears, and for a same-day contract it becomes enormous in the final hours — a 0DTE option near its strike can swing from a 0.20 delta to a 0.80 delta on a move a 30-day option would barely register. With index options now expiring every weekday, this hyper-concentrated gamma exists every single session, parked in a narrow band around spot and migrating as the day's flow arrives.
Practical consequences:
- Levels move intraday. A profile built from overnight open interest misses everything traded since the bell. On active days, the effective afternoon walls are not the morning's walls.
- Pinning intensifies. A heavily traded 0DTE strike can hold price in a band of a few points for hours — then release it sharply once price escapes far enough that the strike's gamma no longer bites.
- Everything expires at the close. 0DTE gamma is gone at settlement. Whatever structure it imposed on today imposes nothing on tomorrow.
Using GEX without fooling yourself
GEX earns a place as context, never as a standalone system, and it is worth being specific about what loses. Fading a break of the put wall because the level "should hold" is a short-volatility bet placed in precisely the regime where short-volatility bets hurt most. Buying every dip in a negative-gamma tape works until the day it doesn't, and that day tends to be large — negative gamma means the market's stabilizers are absent. Scheduled catalysts run over hedging flow without ceremony: a wall is a statement about option positioning, not about what the next inflation print contains.
Two habits keep the tool honest. Establish the sign of the regime before caring about any individual level, because the same wall means different things on opposite sides of the flip. And require confluence — volume behavior at the level, order flow as price approaches it — before treating a wall as tradeable rather than merely visible.
The map is redrawn nightly, and on heavy 0DTE sessions it is redrawn hourly. Dealer positioning is among the most perishable structures in the market; read every gamma level as if it carries a timestamp, because it does.