gamma levels atas
You don't have to switch platforms to trade the gamma structure. Mint one API key and my call wall, put wall, gamma flip and the full gamma-by-strike profile draw on your own ATAS chart — the same levels my terminal draws, recomputed through the session. Included with Pro; today's walls are free to read on the levels page first.
Both screens
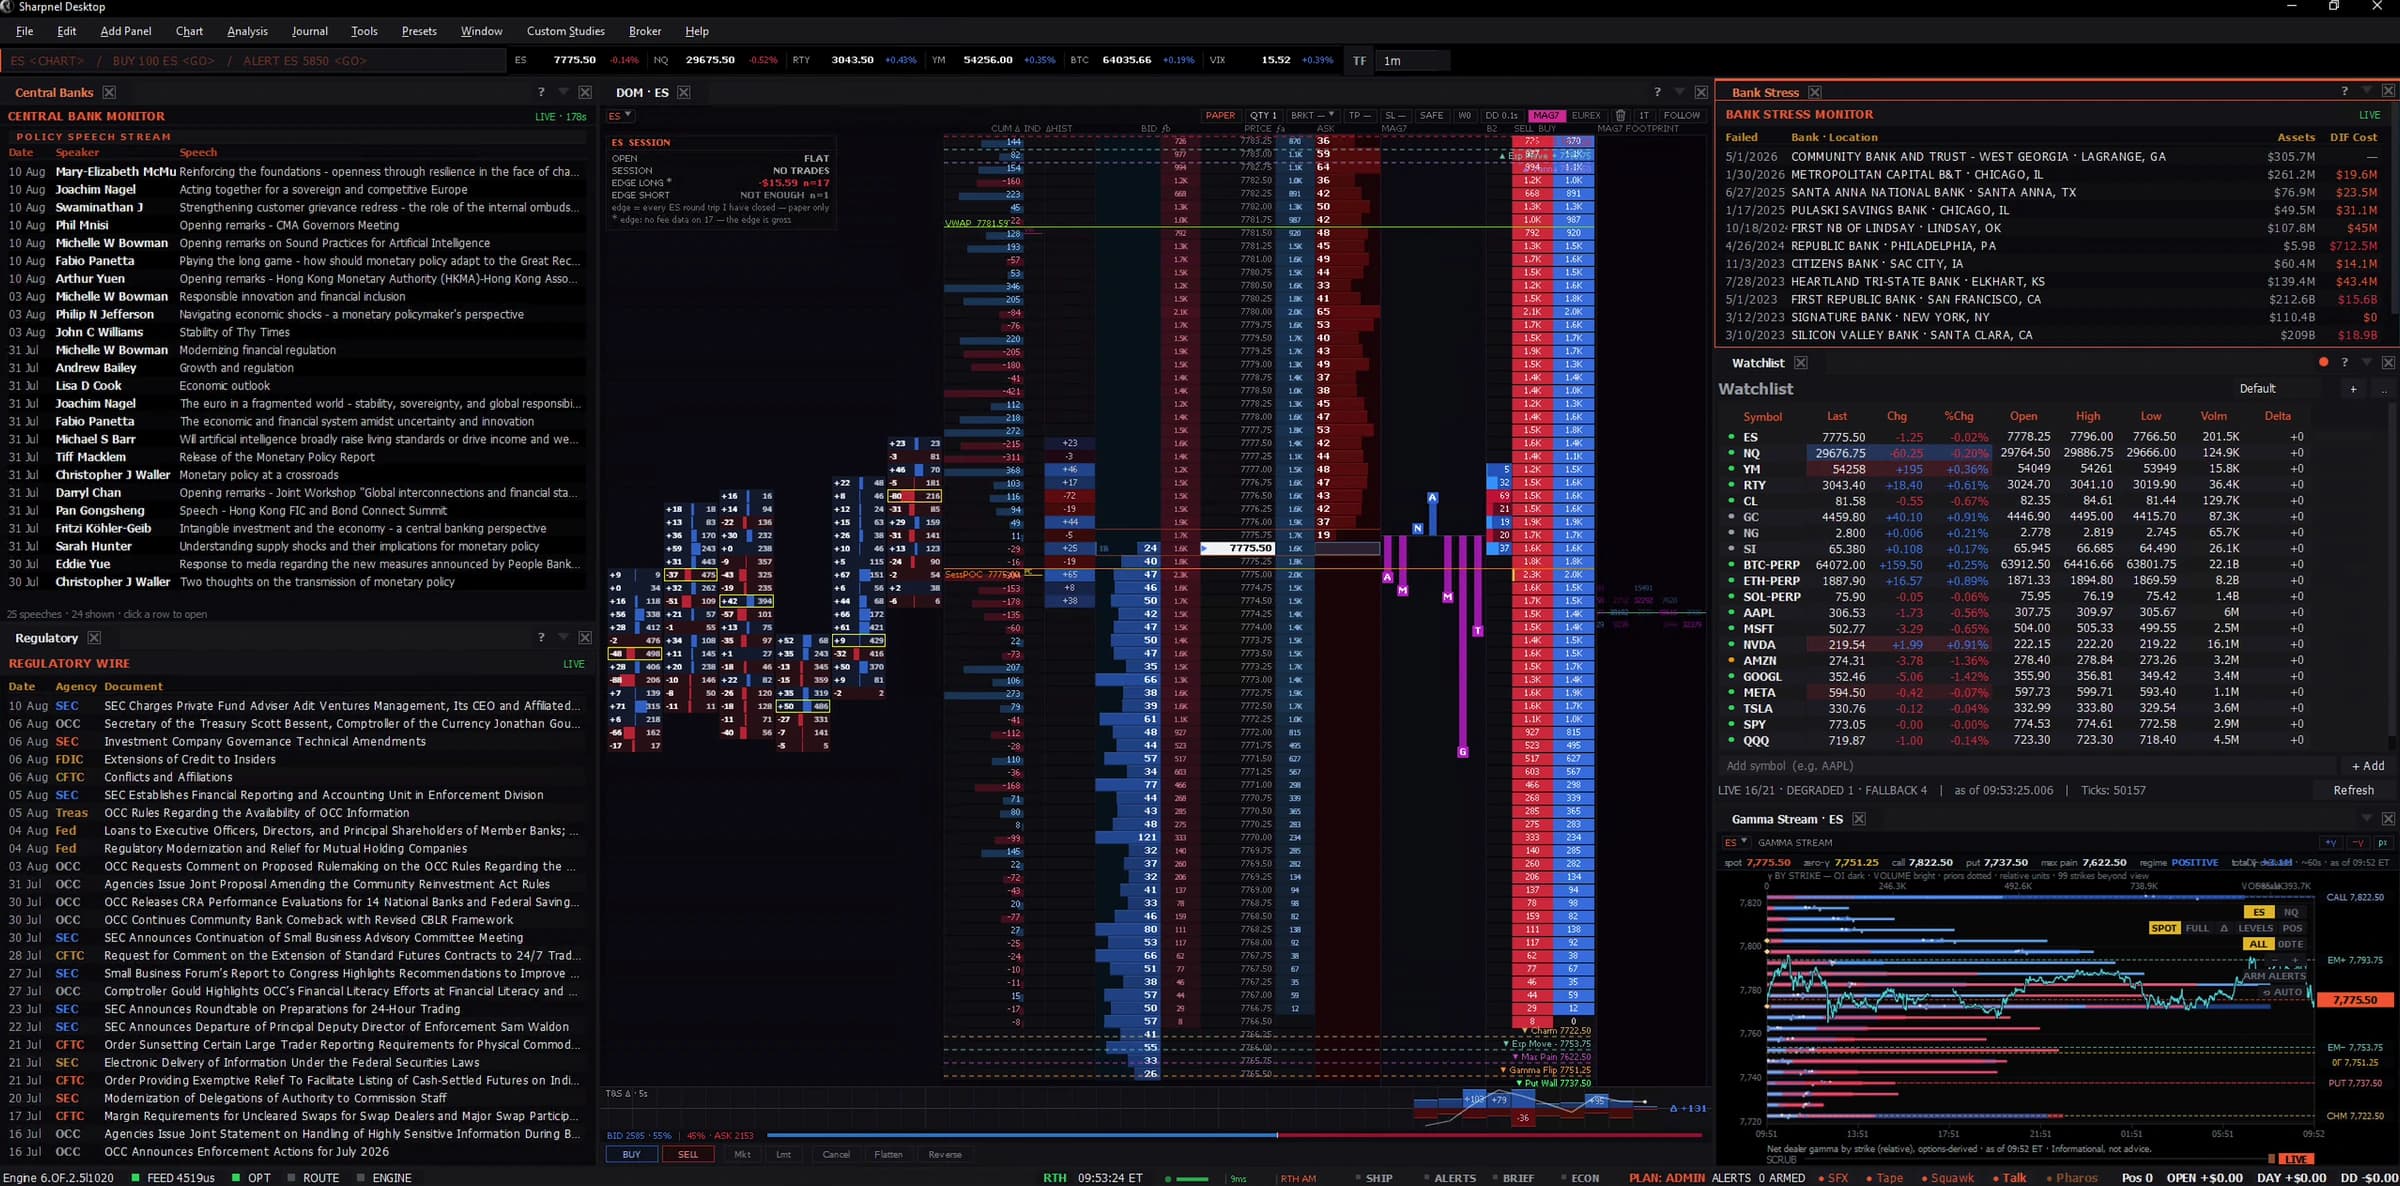
The walls are computed once and drawn identically in either place. Keep the terminal open for the read and the same levels on the ATAS chart you already place orders from, both on one key.
The problem
The dealer-positioning read lives in a browser dashboard and your execution lives in your platform. So you read a number in one window, alt-tab, and eyeball roughly where it lands on the chart you actually trade. The level never touches the thing you press buttons on.
Your ATAS workspace is years of chart templates, hotkeys and instrument settings. "Just use our terminal instead" is a real cost, and it's the honest reason most traders never try a gamma product at all.
Open interest updates on the exchange's daily cycle, but spot and implied volatility move all session — so the gamma flip genuinely migrates, most visibly on heavy 0DTE days. A level screenshotted at 8am is not the level at 2pm.
What Sharpnel does
A study you install once. The levels render as real chart objects on your ATAS chart, at your instrument's own prices, next to whatever else you already run.
Call wall, put wall, gamma flip, max pain, the expected-move band, the top gamma strikes, and the full gamma-by-strike profile — the same objects the terminal draws.
The key is included with Pro — no separate purchase — and the same one works across every supported platform, so running two charting setups costs you nothing extra. Want to check the read first? Today’s walls are published free on the levels page and graded against the real session the same day.
| The job | A standalone gamma dashboard | Sharpnel levels in ATAS |
|---|---|---|
| Where the level lives | In a browser tab, beside the chart you trade | As a chart object on your own ATAS chart |
| What you do with it | Read a number, switch windows, estimate where it sits | Watch price approach the line on the chart you're already reading |
| What it costs you to adopt | A second subscription and a second window | One study install; your workspace is untouched |
Open-interest-derived dealer-gamma estimate, recomputed intraday. Informational, not advice. You pay your own broker/exchange market-data fees.
Free Explorer tier. No credit card required.
About ten minutes, once.
ATAS is an order-flow platform, so the walls land next to the footprint and the cluster chart you already read — the gamma-by-strike profile draws from the left edge, the walls, flip and expected-move band as horizontal levels. Built against the current ATAS Platform; an ATAS older than its .NET 10 builds will not load the DLL.
Keep your charts. Add the voice.
You do not have to switch. The study draws the walls inside ATAS, and the Sharpnel terminal runs beside it on a second monitor and talks: it tells you when price reaches a wall, whether the ladder is absorbing there, when you have taken out the London low, when CPI is sixty seconds away. Same key, same walls, your charts. What it said yesterday is on the levels page, in its own voice.
