The Fed liquidity & risk sheet leads, with the net-liquidity tide, the stress decomposition and the dealer/funding plumbing tabbed behind it; RRP + fiscal-cash drains left, repo/SOFR + swap lines + money funds right, the rates sheet + M2/bank credit along the bottom
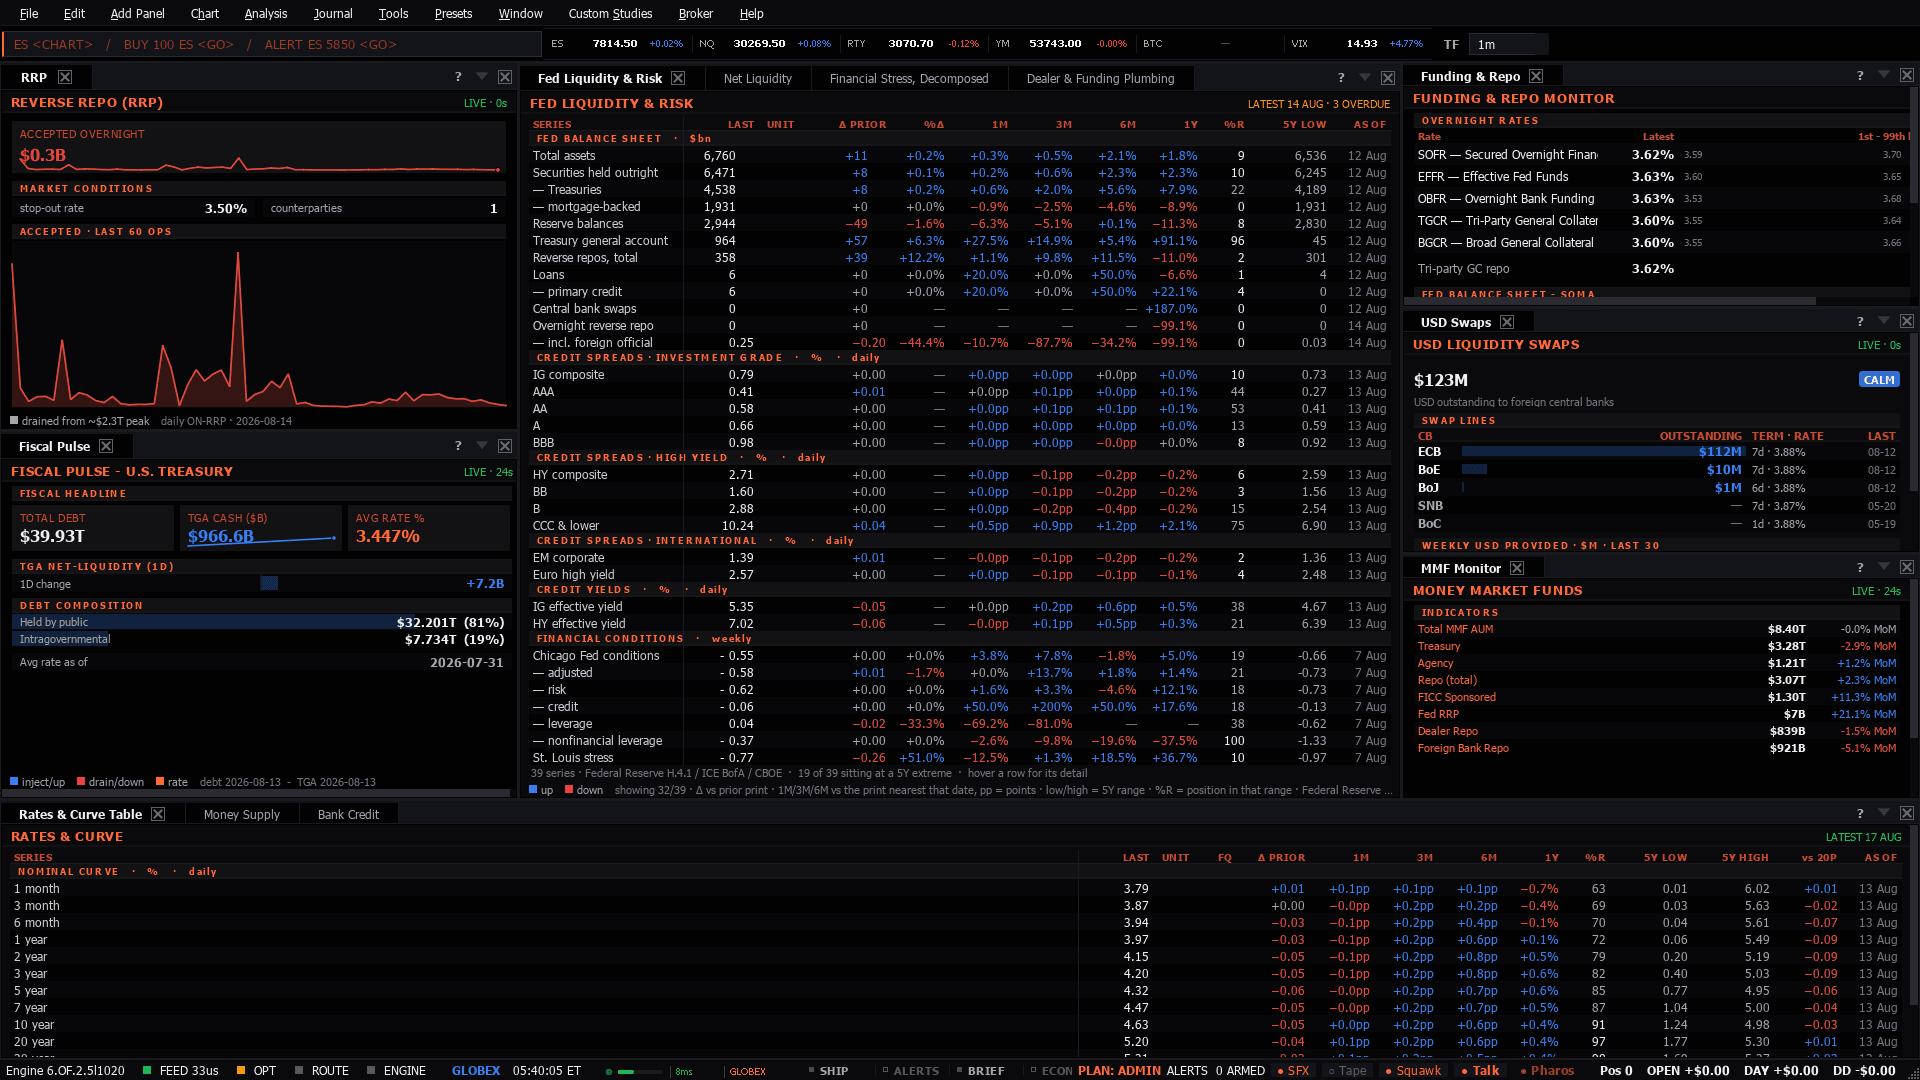
The Fed liquidity & risk sheet leads, with the net-liquidity tide, the stress decomposition and the dealer/funding plumbing tabbed behind it; RRP + fiscal-cash drains left, repo/SOFR + swap lines + money funds right, the rates sheet + M2/bank credit along the bottom
Use it when: When price action is not explained by news and you suspect the plumbing.
The plumbing behind every risk asset. It explains sessions where price does something the news does not justify.
Net liquidity falling while ES rises can persist for months. This is a condition, not a signal - read it as the backdrop you are trading against.
Same, more so. High-beta rallies are the first to lose their footing when funding tightens.
Marginal. Crude responds to its own supply and demand far more than to funding conditions.
Presets in the menu bar, under the category this desk belongs to — one click applies the whole layout, and a checkmark tracks which one is active.Ctrl+P, which finds it by name.show me liquidity.Add Panel menu.The tell: Net liquidity falling while equities rise can persist for months. It is a condition, not a signal — treat it as the backdrop, not the trade.
8 panels, read straight from the preset definition in the desktop build:
Plus 4 dense sheets — wide tables that carry a whole complex in one upstream call rather than a wall of single-series tiles:
These desks assume the theory. If any of it is unfamiliar, the background reading is on the learn side:
