Macro · 28
Index futures price future cash flows. Every macro release you watch reaches the contract through one of two channels — the rate you discount those cash flows at, or the cash flows themselves — and that is the whole reason NQ and ES do not move together.
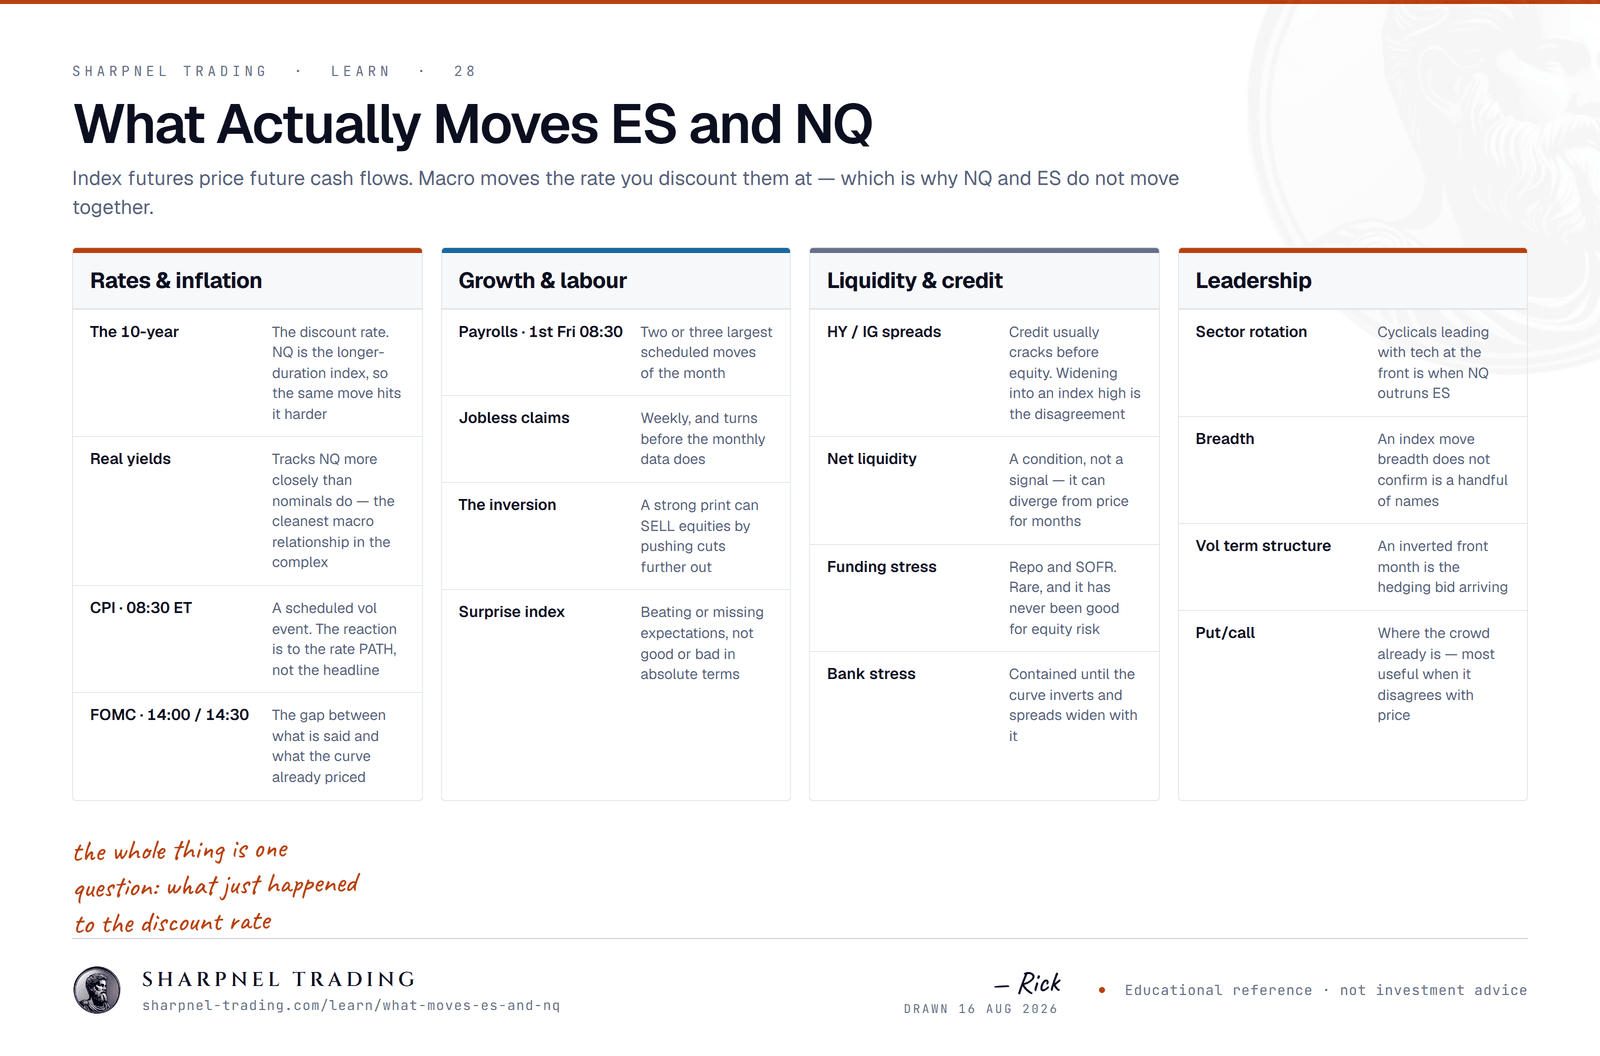
<a href="https://www.sharpnel-trading.com/learn/what-moves-es-and-nq"><img src="https://www.sharpnel-trading.com/images/learn/what-moves-es-and-nq-w1600.png" alt="A four-column reference for what moves ES and NQ futures: rates and inflation including the 10-year, real yields, CPI at 8:30 ET and FOMC; growth and labour including payrolls and jobless claims; liquidity and credit including high-yield spreads and funding stress; and leadership including sector rotation, breadth and the volatility term structure." width="100%"></a><p>Via <a href="https://www.sharpnel-trading.com/learn/what-moves-es-and-nq">Sharpnel Trading</a></p>
An index future is a claim on a stream of future corporate earnings. Its price is those earnings discounted back to today. That means there are only two ways any macro release can move it: by changing the earnings, or by changing the rate you discount them at.
Almost everything on the economic calendar works through the discount rate. That is counter-intuitive the first time you see it — a strong jobs number is good news for earnings, and equities sell off anyway, because the same number pushed rate cuts further out and the discount rate went up by more than the earnings did. The release did not become bad news. It just arrived through the louder channel.
The one thing worth internalising
If you only watch one thing, watch the 10-year real yield. It is the nominal yield with expected inflation stripped out, which makes it the actual cost of money — and over the last several years it has tracked the Nasdaq more closely than any other single macro series. When real yields rise sharply and NQ does not fall, one of the two is about to move.
| What | What it represents | How it reaches the index |
|---|---|---|
| 10-year yield | The discount rate on every future dollar of earnings. | Hits NQ harder. Longer duration means more of the value sits further out. |
| 10-year real yield | The nominal yield less breakeven inflation — the actual cost of money. | The cleanest single relationship in the complex. Watch this before nominals. |
| 2-year yield | What the market thinks the policy rate does over the next two years. | Moves first on data. The 2s10s spread is the growth-versus-policy argument. |
| Breakevens | The inflation the bond market has already priced. | A CPI print that matches the breakeven is not a surprise, whatever the headline says. |
| HY / IG credit spreads | What lenders charge for risk. | Usually cracks before equity. Widening into an index high is a real disagreement. |
| Dollar index | The global funding cost and a direct hit to overseas revenue. | Roughly 30% of S&P revenue is earned abroad; a strong dollar shrinks it in reporting. |
The 2s10s spread deserves its own note. The 2-year is mostly a policy expectation and the 10-year is mostly a growth-plus-term-premium expectation, so the spread between them is the market arguing with itself about whether policy is too tight for the growth on offer. Steepening driven by the long end is a growth story; steepening driven by the front end is a cutting story. Those two look identical on a spread chart and mean opposite things for cyclicals.
These are the releases that reliably produce a discrete move rather than a drift. Everything else on the calendar is worth knowing about and rarely worth trading around.
| Release | When | What it does to the index |
|---|---|---|
| CPI | 08:30 ET, monthly | Repriced the rate path — the reaction is to core and the trend, not the headline. |
| Non-farm payrolls | 08:30 ET, first Friday | Regularly one of the two or three largest scheduled moves of the month. |
| FOMC decision | 14:00 ET, then 14:30 presser | The move is usually in the presser, not the statement. Two separate events. |
| Jobless claims | 08:30 ET, Thursdays | Weekly, and it turns before the monthly labour data does. |
| PCE | 08:30 ET, monthly | The measure the Fed actually targets. Often a smaller move than CPI because CPI leaked it. |
| ISM / PMI | 10:00 ET, monthly | Growth, not policy. Moves cyclicals and therefore the ES-versus-NQ spread. |
Data does not move price. The difference between the data and what was already priced moves price. A hot CPI that comes in exactly where the breakevens and the fixings implied is not a hot CPI as far as the market is concerned. This is why economic surprise indices are more useful for reading equity reactions than the raw prints: they are already expressed as beats and misses.
The second reason is that the first move is often not the move. Large scheduled releases produce a liquidity vacuum — resting size pulls before the number and returns afterwards — so the initial spike is frequently a thin-book artefact that gets retraced within minutes. The tradeable move tends to be the second one, once the book has refilled and the level has been tested.
The economic calendar tells you when to expect volatility. It does not tell you which way the market is leaning underneath. That comes from the risk-appetite complex, and it moves continuously rather than on a schedule.
Because the two indices have different duration and different sector weights, the ratio between them is a live read on what the market currently believes. You do not need to trade the spread to use it.
Every series named here is a panel, and the presets group them the way you would actually read them in the morning. The three that matter most for index futures:
For the intraday layer on top of this — where dealer positioning turns a macro impulse into a level — see gamma exposure, and for the crude side of the same macro complex, what actually moves crude.
Worth saying plainly, because a lot of attention goes to things that do not pay. Single-name earnings outside the largest handful of index constituents do not move the index. Most secondary economic releases — regional Fed surveys, revisions to old data, consumer sentiment — produce a blip and nothing more. Political headlines move it only when they change the fiscal or rate path, which is rare and usually obvious. And the previous day's closing level has no memory: overnight repricing in the rates complex is the reason the cash open is where it is, not anything technical about yesterday.
Take this into the terminal
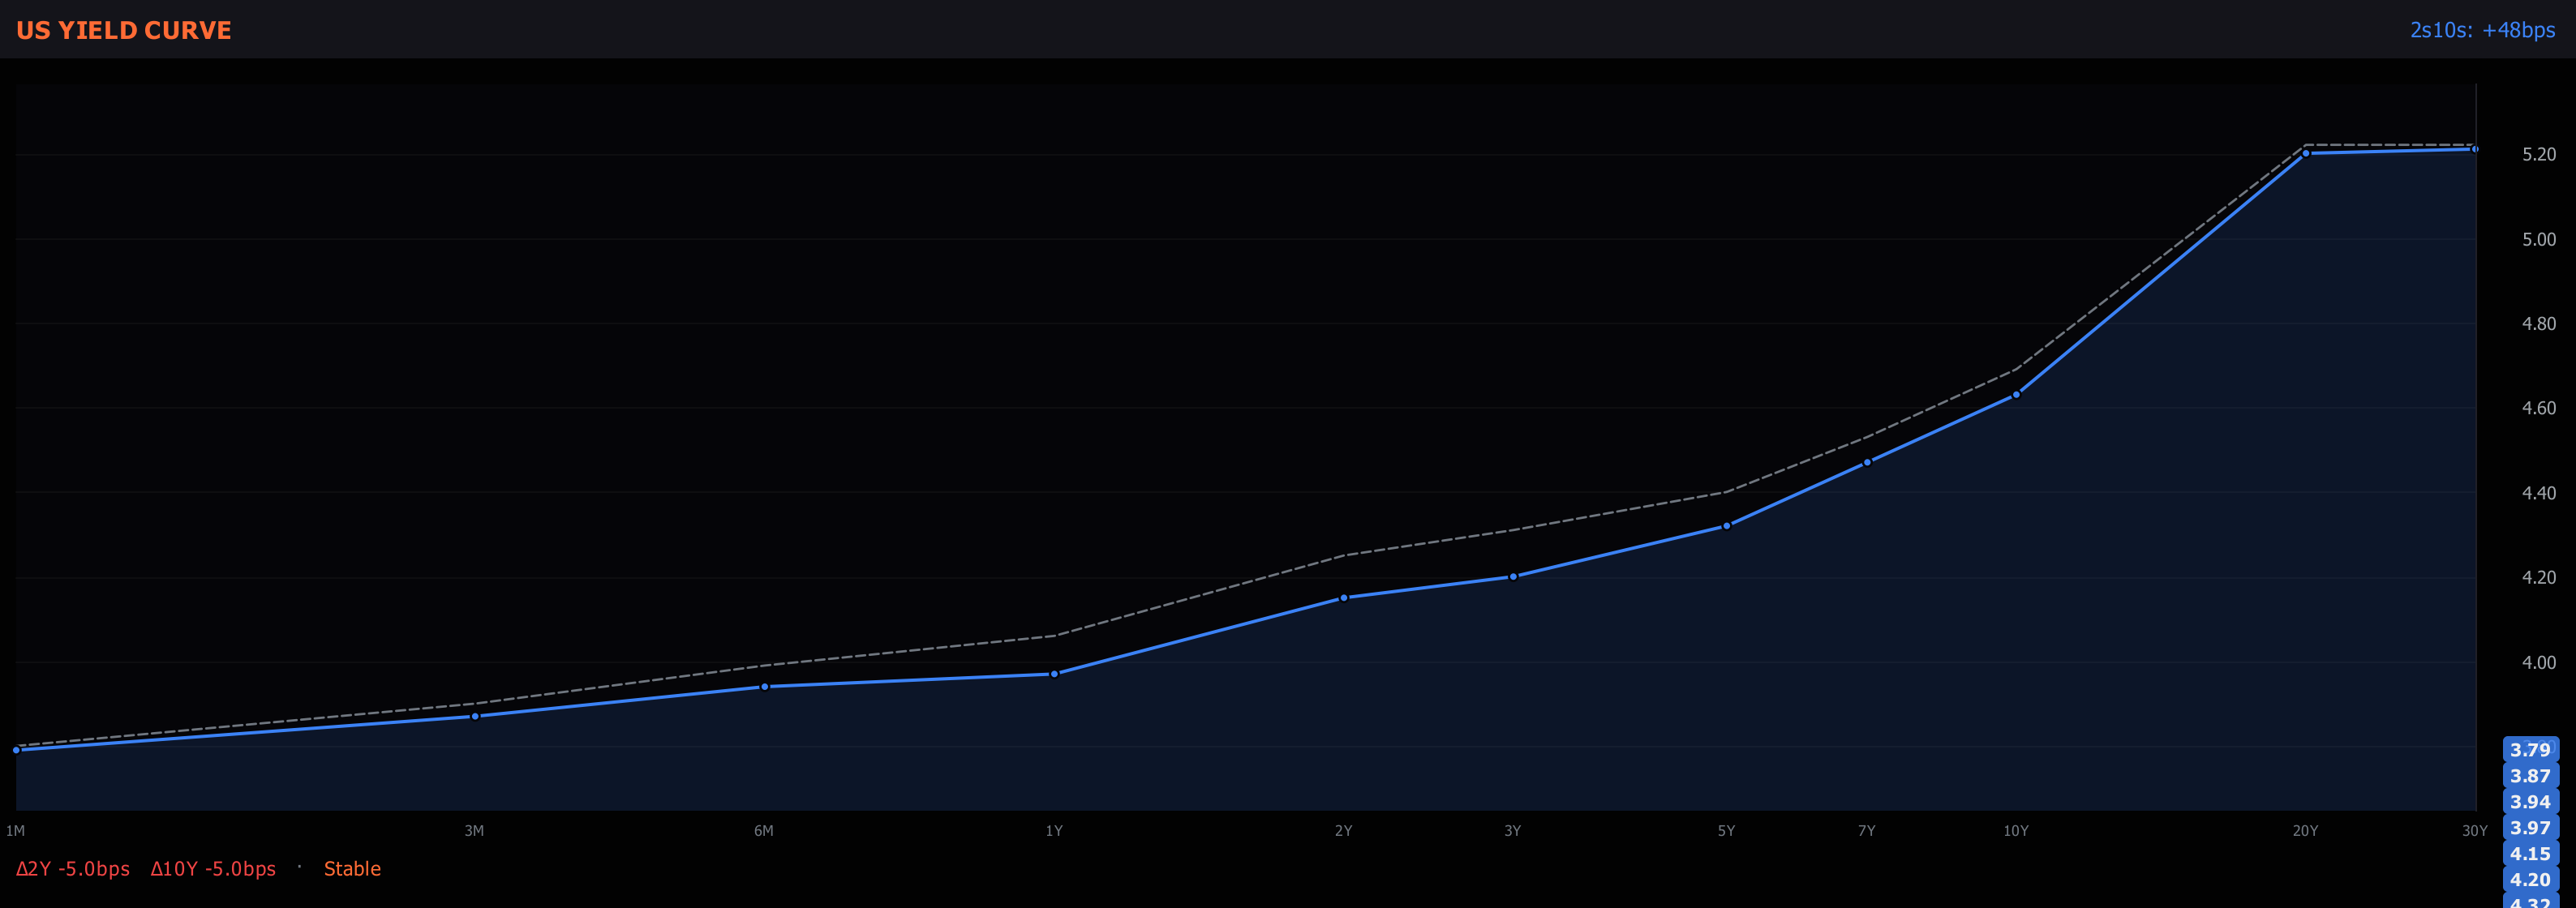
The article's argument is that macro reaches the index through the discount rate, and this is that channel on one screen — the curve, breakevens and the credit spreads that price the same risk the equity market is pricing.
In this workspace
yield curve·credit spreads·treasury auctions
Worth adding — type add ⟨name⟩ in the palette
term structure·economic surprise·put call ratio
Presets sit in the strip under the menu bar — one click applies the whole layout, and every panel can be re-pointed at another symbol from its own header. How to run the Rates Desk desk.
Published August 15, 2026 · Educational reference only. Nothing here is investment advice or a recommendation to buy or sell any security. Fund names and tickers are given to identify what tracks a sector, not to endorse one.
Today’s free read
The ES/NQ dealer-gamma map — the walls, the flip point, the regime — free every morning, yesterday’s levels graded in the open.