Pure rates cockpit: the Treasury curve hero (breakeven + curve-spread tabs), overnight funding plumbing left, credit-spread/CDS context right, and the auction/buyback/debt-cost supply tables along the bottom
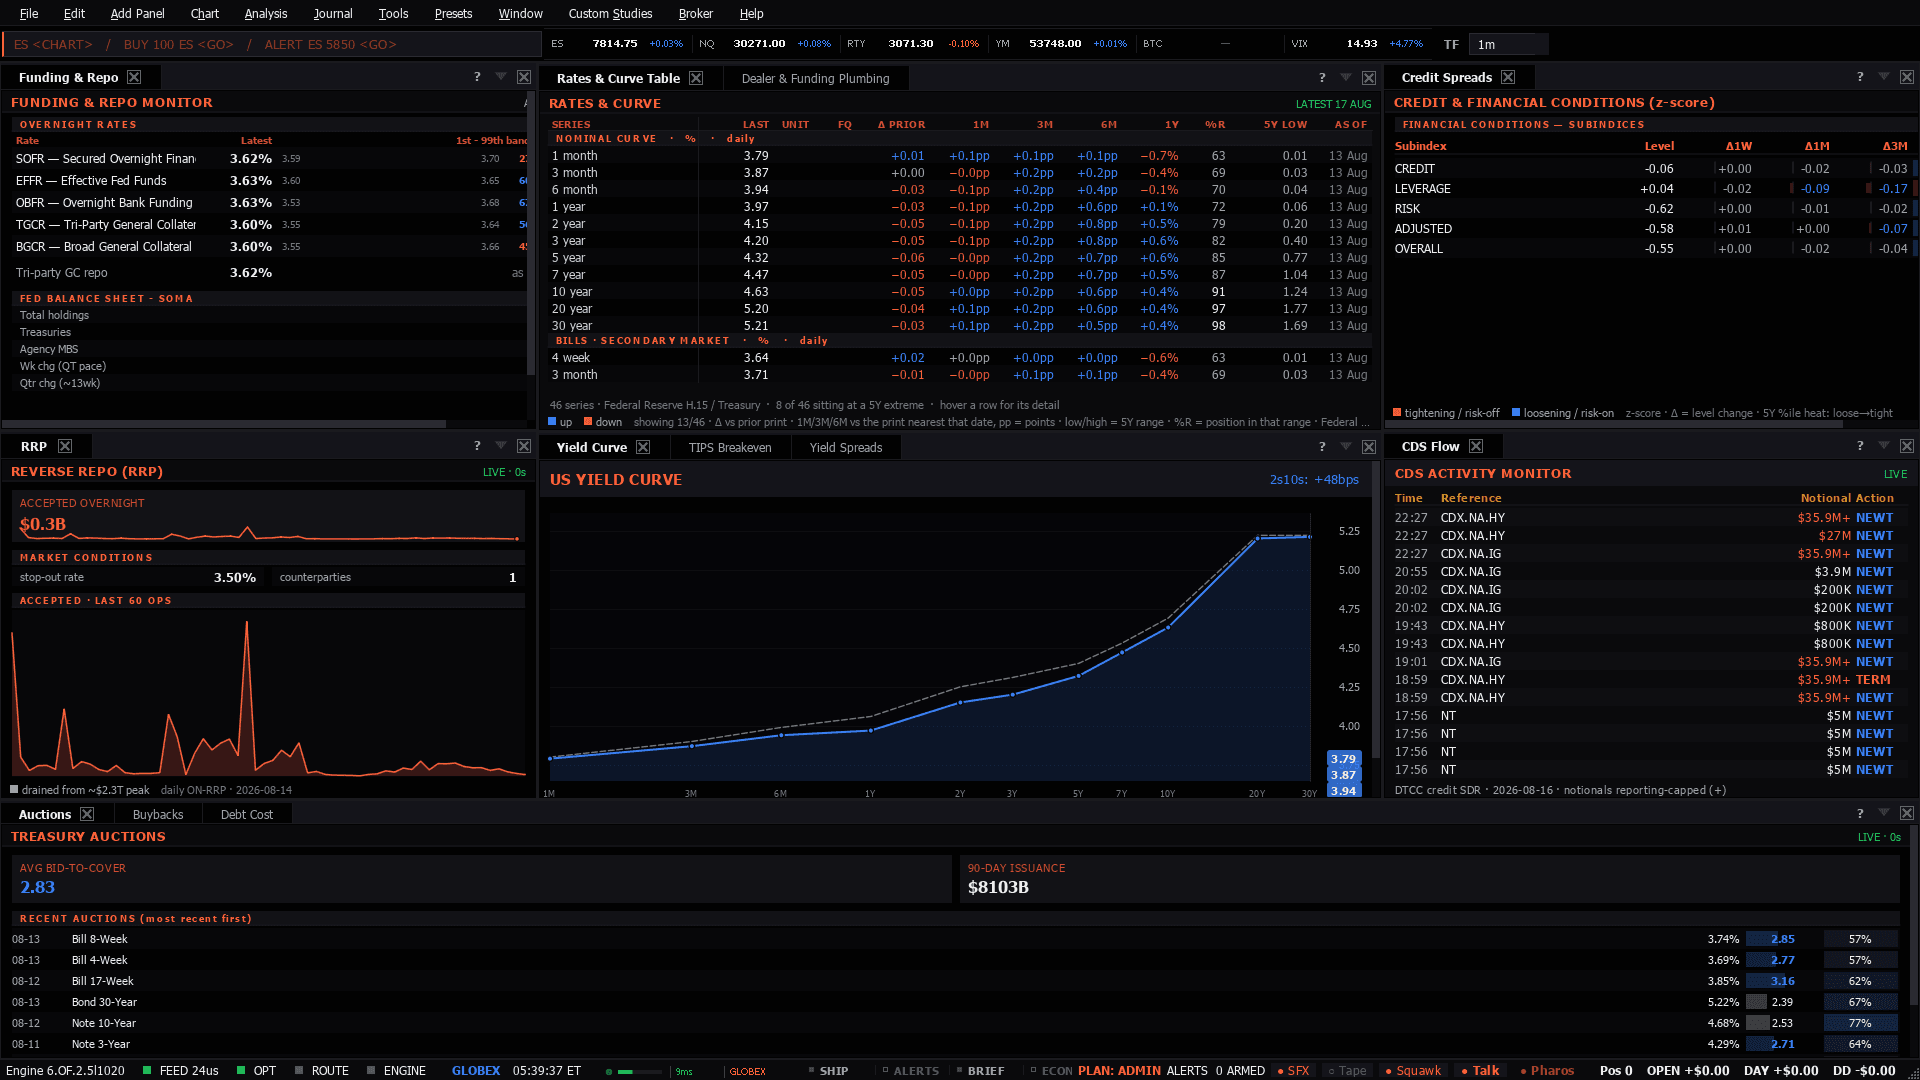
Pure rates cockpit: the Treasury curve hero (breakeven + curve-spread tabs), overnight funding plumbing left, credit-spread/CDS context right, and the auction/buyback/debt-cost supply tables along the bottom
Use it when: Anything that depends on the path of policy rather than on one print.
Rates are the largest macro input to both index futures, and the main reason ES and NQ do not move together.
Less rate-sensitive than NQ, but the thing to read here is WHY the curve moved. A front-end steepening on policy expectations and a long-end steepening on weak auctions look identical on a yield chart and mean opposite things for equity risk.
NQ is the longer-duration index - its constituents' cash flows sit further out, so a given move in the 10Y hits it harder. Watch real yields specifically; NQ tracks them more closely than nominals.
Second-order. Rates reach crude through the dollar and through growth expectations rather than directly.
Presets in the menu bar, under the category this desk belongs to — one click applies the whole layout, and a checkmark tracks which one is active.Ctrl+P, which finds it by name.show me yield curve.Add Panel menu.The tell: A curve that steepens on the front end is a policy expectation; one that steepens on the long end with auctions going badly is a supply problem. They look identical on a single chart.
10 panels, read straight from the preset definition in the desktop build:
Plus 2 dense sheets — wide tables that carry a whole complex in one upstream call rather than a wall of single-series tiles:
These desks assume the theory. If any of it is unfamiliar, the background reading is on the learn side:
