Market structure · 01
Sector leadership moves through the same five phases in the same order — recovery, expansion, peak, slowdown, recession — and then starts again. This is the map of that order, which sectors tend to lead in each phase, and the honest limits of using it.
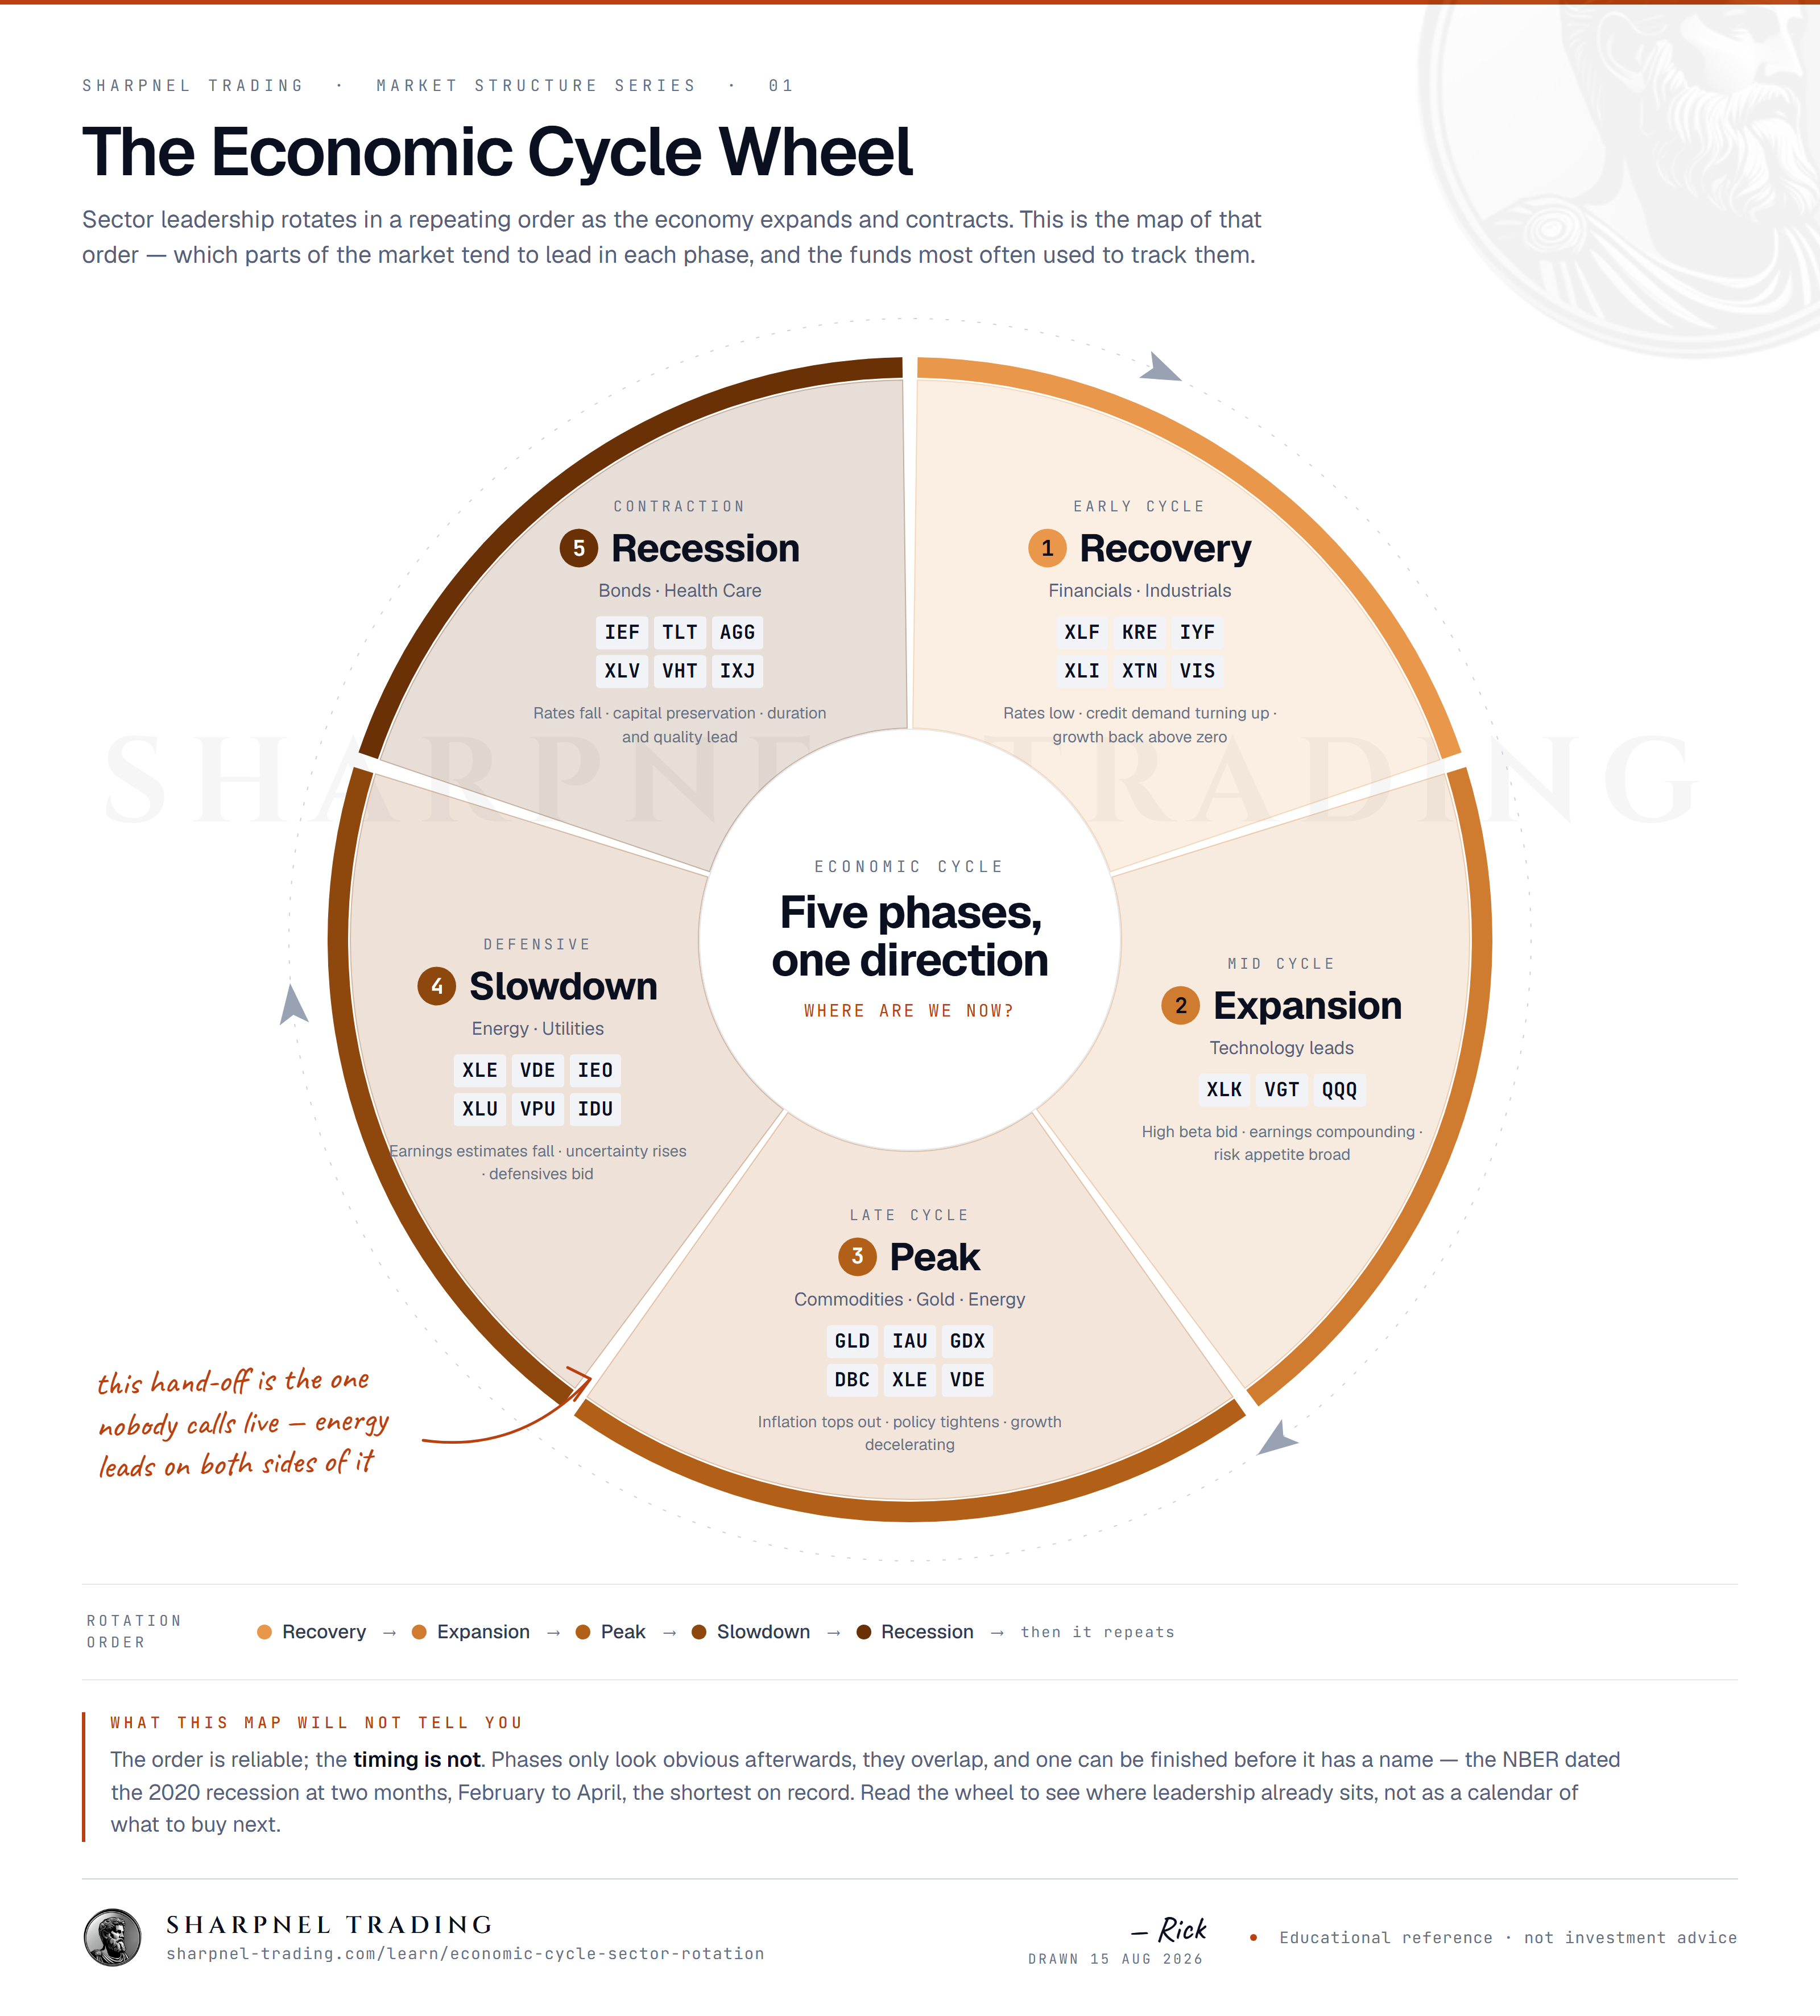
<a href="https://www.sharpnel-trading.com/learn/economic-cycle-sector-rotation"><img src="https://www.sharpnel-trading.com/images/learn/economic-cycle-sector-rotation-w1600.png" alt="The economic cycle wheel. Five phases in a ring — 1 Recovery (financials and industrials: XLF, KRE, IYF, XLI, XTN, VIS), 2 Expansion (technology: XLK, VGT, QQQ), 3 Peak (commodities, gold and energy: GLD, IAU, GDX, DBC, XLE, VDE), 4 Slowdown (energy and utilities: XLE, VDE, IEO, XLU, VPU, IDU), 5 Recession (bonds and health care: IEF, TLT, AGG, XLV, VHT, IXJ) — turning clockwise and repeating." width="100%"></a><p>Via <a href="https://www.sharpnel-trading.com/learn/economic-cycle-sector-rotation">Sharpnel Trading</a></p>
Sector rotation is the observation that different parts of the stock market lead at different points in the economic cycle, in a repeating order. When growth is accelerating from a low base, money tends to favour the sectors whose earnings are most sensitive to that acceleration — banks, industrials, transport. When growth is contracting, it favours the sectors whose earnings barely notice — utilities, staples, health care — along with government bonds.
The business-cycle framing is not new or proprietary. The version most people have seen traces back to Sam Stovall’s sector-rotation work at S&P in the 1990s, and Fidelity has published a business-cycle sector framework along the same lines for years. What follows is that standard map, with the tickers checked and the caveats left in.
Each phase is defined by what growth and inflation are doing, not by what the index is doing. Leadership is the symptom; the cycle is the cause.
| Phase | Stage | Leadership | What is happening |
|---|---|---|---|
| 1. Recovery | Early cycle | Financials, industrials | Rates are low, credit demand turns up, growth crosses back above zero |
| 2. Expansion | Mid cycle | Technology | High-beta bid, earnings compounding, risk appetite broad |
| 3. Peak | Late cycle | Commodities, gold, energy | Inflation tops out, policy tightens, growth decelerating |
| 4. Slowdown | Defensive | Energy, utilities | Earnings estimates fall, uncertainty rises, defensives bid |
| 5. Recession | Contraction | Bonds, health care | Rates fall, capital preservation, duration and quality lead |
Growth is negative but improving. Central banks are still easy, the yield curve is steepening, and the sectors that make money on credit volume start to work first: banks (XLF, KRE, IYF) and the industrial and transport complex (XLI, XTN, VIS). Regional banks are the sharpest expression of the credit leg and the most volatile.
The longest phase, and the narrowest leadership in this framework: technology and high-beta growth (XLK, VGT, QQQ). Earnings are compounding, credit is available, and the market pays up for duration in equities the same way it does in bonds.
Growth is still positive but decelerating, and inflation is at its highest. Real assets lead: gold (GLD, IAU, GDX), broad commodities (DBC) and energy (XLE, VDE). This is the phase most often misread in real time, because the index can keep making highs while the internals have already turned.
Earnings estimates start coming down. Energy often keeps working into the early part of this phase (XLE, VDE, IEO) while the defensive bid builds in utilities (XLU, VPU, IDU). The overlap is real and it is why phases 3 and 4 are the hardest pair to separate.
Growth is negative. Rates fall, so duration works: Treasuries and aggregate bonds (IEF, TLT, AGG). In equities the bid is for earnings that do not depend on the cycle — health care (XLV, VHT, IXJ).
Five phases is more precision than the data usually supports. The split that survives contact with a live tape is the binary one underneath it: cyclical versus defensive.
You do not need to name the phase to use that. If defensives are top of the one-month relative-strength ranking, the market is expressing a late-cycle or recessionary view, whatever the GDP print eventually says.
The trap in this framework is treating it as a forecast. Economic data is revised and arrives late; the NBER dates recessions long after they end. Relative strength does not have that problem, because leadership is observable today.
The practical method is to rank the eleven sectors by their relative performance against the S&P over a rolling window — a month is the common choice — and read which side of the cyclical/defensive split is on top. That is a measurement, not a prediction, and it updates every session.
Where this sits in the terminal
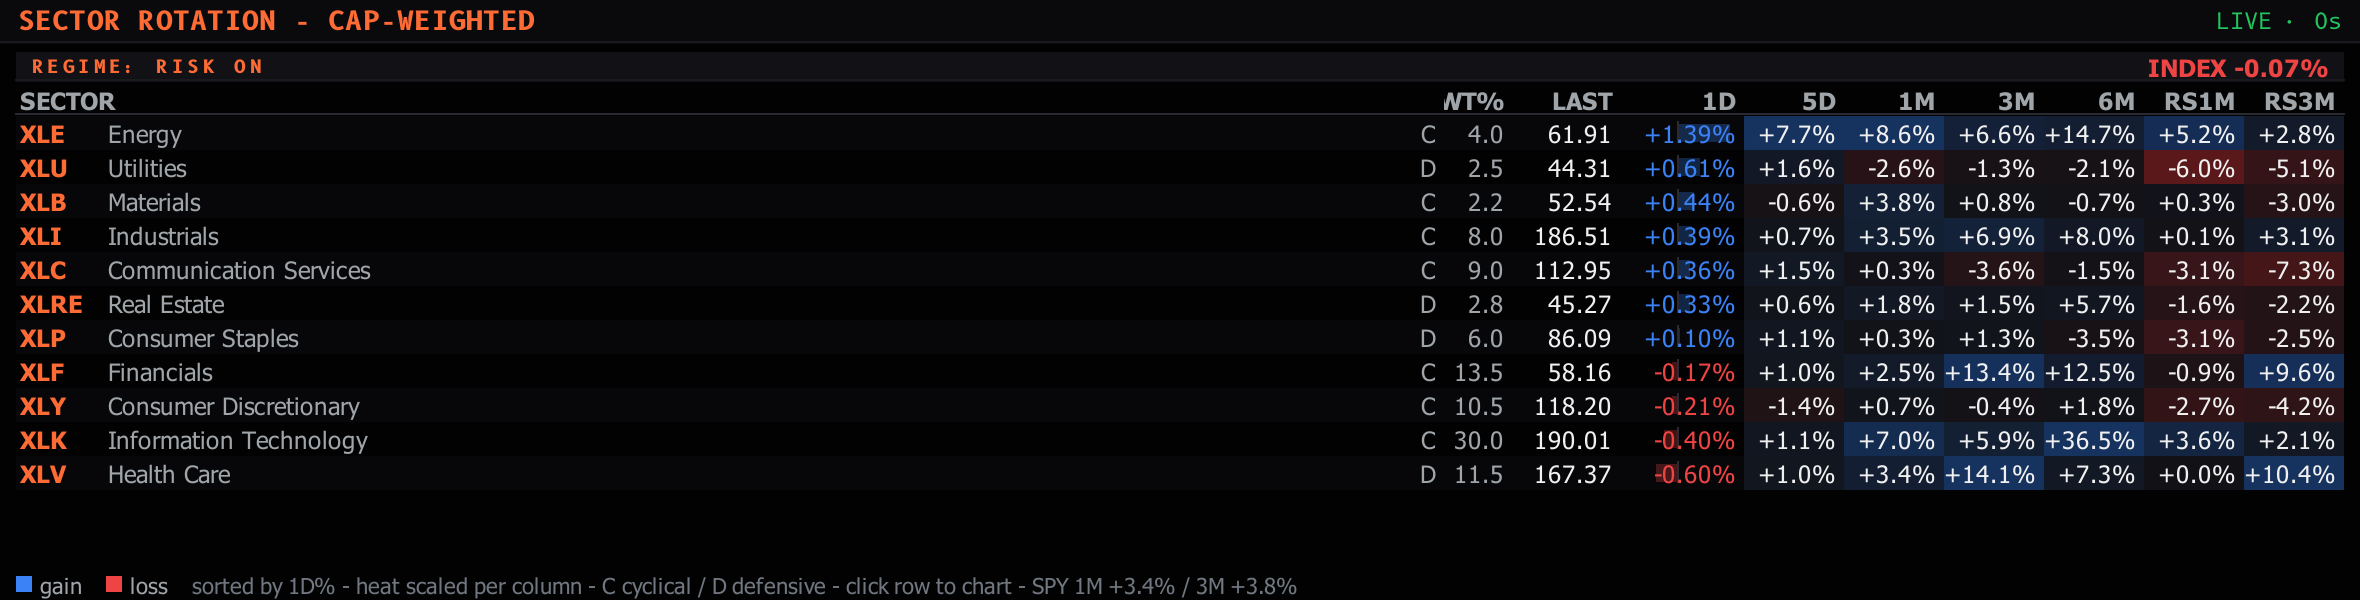
This is what the ROTATION panel in the Sharpnel desktop terminal does: all eleven SPDR sector ETFs benchmarked against SPY at 1-day, 5-day, 1-month, 3-month and 6-month horizons, sorted by one-month relative strength so the current leader is at the top, with each sector tagged cyclical or defensive. It classifies the top half of that ranking as RISK ON, DEFENSIVE or MIXED. The wheel above is the map that reading is made against. Panel documentation.
The order is the reliable part. Almost everything else about it is softer than the diagram suggests, and a page that sells you the diagram without saying so is doing you a disservice.
Read leadership first and label the phase second — never the reverse. If you start from “we are late cycle” you will find the sectors that confirm it. If you start from the relative-strength ranking, you get a measurement that can disagree with you, which is the only kind worth having.
Then treat the result as one input among several. Sector leadership tells you the regime the market is currently pricing. It does not tell you what happens on Tuesday.
Take this into the terminal
The article's actual advice is to read leadership rather than forecast the phase, and this is the board that ranks the eleven sectors and calls the regime off them.
In this workspace
sector rotation·term structure·put call ratio
Worth adding — type add ⟨name⟩ in the palette
Presets sit in the strip under the menu bar — one click applies the whole layout, and every panel can be re-pointed at another symbol from its own header. How to run the Risk Monitor desk.
Published August 14, 2026 · Educational reference only. Nothing here is investment advice or a recommendation to buy or sell any security. Fund names and tickers are given to identify what tracks a sector, not to endorse one.
Today’s free read
The ES/NQ dealer-gamma map — the walls, the flip point, the regime — free every morning, yesterday’s levels graded in the open.