Market structure · 02
The five phases of the economic cycle, expanded into the funds most commonly used to track each one — with full names, cyclical or defensive classification, and three corrections to the version of this chart that circulates everywhere.
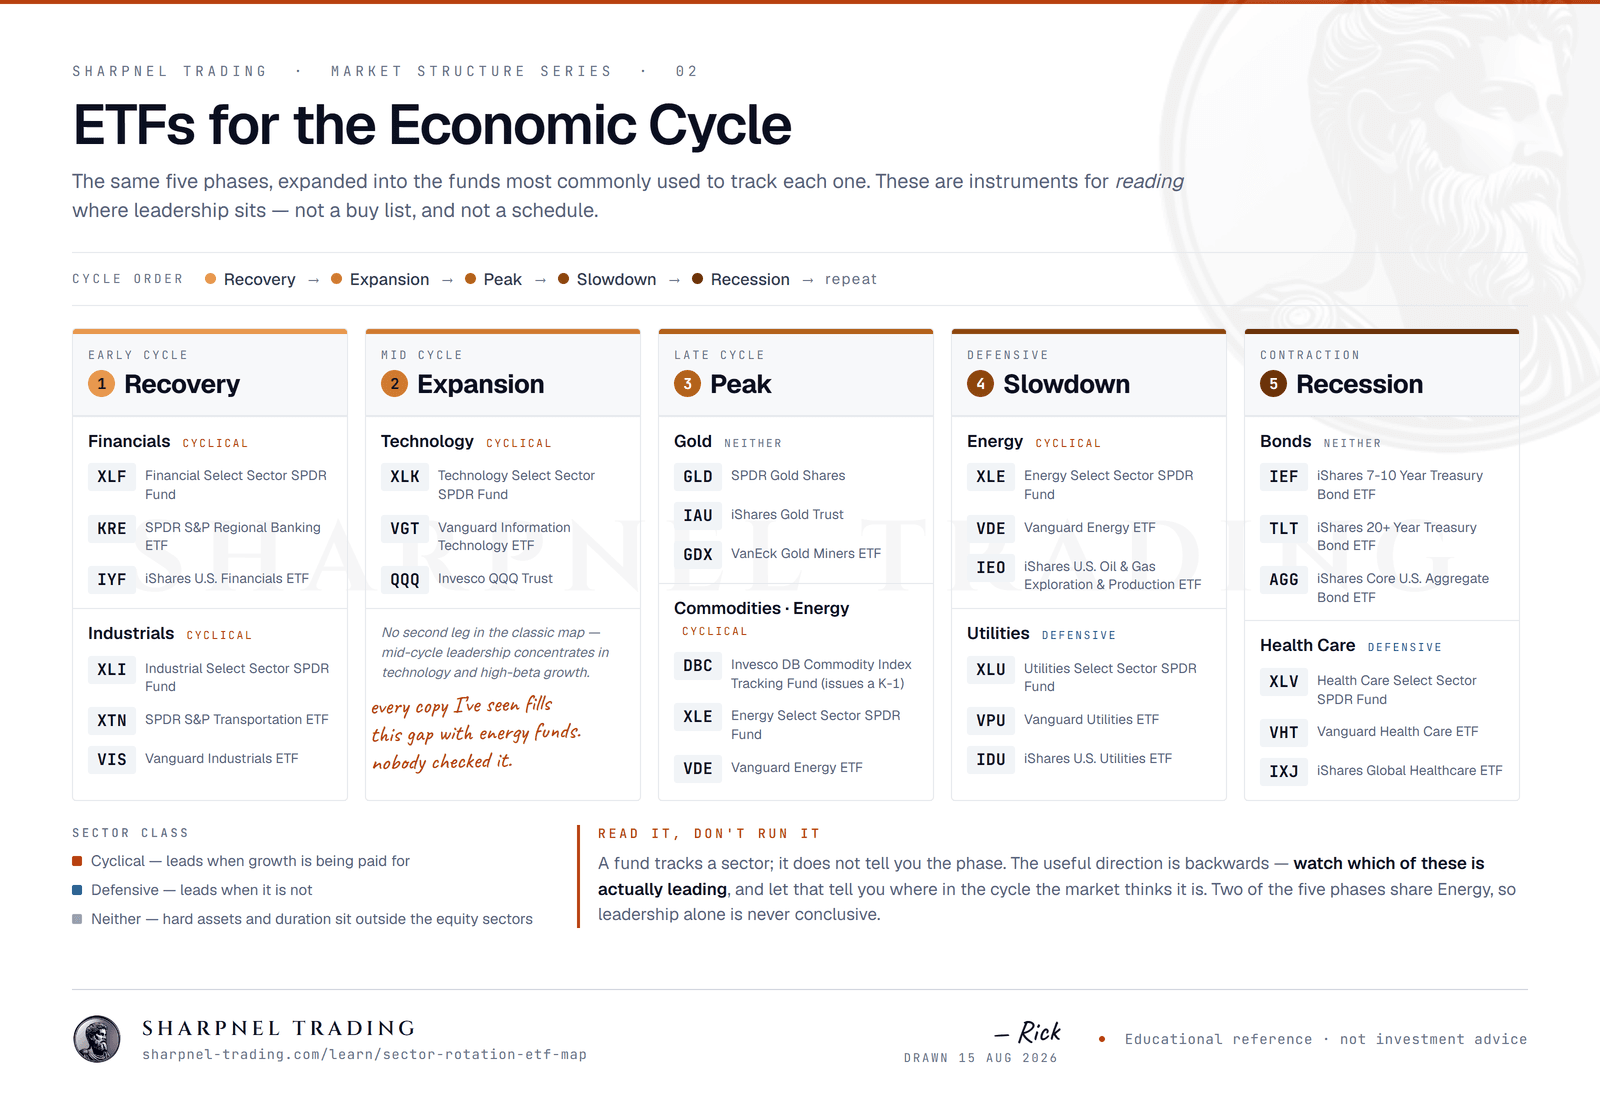
<a href="https://www.sharpnel-trading.com/learn/sector-rotation-etf-map"><img src="https://www.sharpnel-trading.com/images/learn/sector-rotation-etf-map-w1600.png" alt="ETFs for the economic cycle. Five columns — Recovery (XLF, KRE, IYF, XLI, XTN, VIS), Expansion (XLK, VGT, QQQ), Peak (GLD, IAU, GDX, DBC, XLE, VDE), Slowdown (XLE, VDE, IEO, XLU, VPU, IDU), Recession (IEF, TLT, AGG, XLV, VHT, IXJ) — each fund labelled cyclical, defensive or neither." width="100%"></a><p>Via <a href="https://www.sharpnel-trading.com/learn/sector-rotation-etf-map">Sharpnel Trading</a></p>
These are instruments for reading where leadership sits. A fund tracks a sector; it does not tell you the phase, and nothing below is a recommendation to buy anything. If you want the framework this table sits inside, start with the economic cycle wheel.
| Ticker | Fund | Sector | Class |
|---|---|---|---|
| XLF | Financial Select Sector SPDR Fund | Financials | Cyclical |
| KRE | SPDR S&P Regional Banking ETF | Financials | Cyclical |
| IYF | iShares U.S. Financials ETF | Financials | Cyclical |
| XLI | Industrial Select Sector SPDR Fund | Industrials | Cyclical |
| XTN | SPDR S&P Transportation ETF | Industrials | Cyclical |
| VIS | Vanguard Industrials ETF | Industrials | Cyclical |
| Ticker | Fund | Sector | Class |
|---|---|---|---|
| XLK | Technology Select Sector SPDR Fund | Technology | Cyclical |
| VGT | Vanguard Information Technology ETF | Technology | Cyclical |
| QQQ | Invesco QQQ Trust | Technology | Cyclical |
| Ticker | Fund | Sector | Class |
|---|---|---|---|
| GLD | SPDR Gold Shares | Gold | Neither |
| IAU | iShares Gold Trust | Gold | Neither |
| GDX | VanEck Gold Miners ETF | Gold | Neither |
| DBC | Invesco DB Commodity Index Tracking Fund | Commodities and energy | Cyclical |
| XLE | Energy Select Sector SPDR Fund | Commodities and energy | Cyclical |
| VDE | Vanguard Energy ETF | Commodities and energy | Cyclical |
| Ticker | Fund | Sector | Class |
|---|---|---|---|
| XLE | Energy Select Sector SPDR Fund | Energy | Cyclical |
| VDE | Vanguard Energy ETF | Energy | Cyclical |
| IEO | iShares U.S. Oil & Gas Exploration & Production ETF | Energy | Cyclical |
| XLU | Utilities Select Sector SPDR Fund | Utilities | Defensive |
| VPU | Vanguard Utilities ETF | Utilities | Defensive |
| IDU | iShares U.S. Utilities ETF | Utilities | Defensive |
| Ticker | Fund | Sector | Class |
|---|---|---|---|
| IEF | iShares 7-10 Year Treasury Bond ETF | Bonds | Neither |
| TLT | iShares 20+ Year Treasury Bond ETF | Bonds | Neither |
| AGG | iShares Core U.S. Aggregate Bond ETF | Bonds | Neither |
| XLV | Health Care Select Sector SPDR Fund | Health care | Defensive |
| VHT | Vanguard Health Care ETF | Health care | Defensive |
| IXJ | iShares Global Healthcare ETF | Health care | Defensive |
Expansion has one leg, not two
Most copies of this chart show a second row under expansion filled with energy and industrial funds. That is an error that propagated — those are late-cycle and early-cycle sectors, and putting them under a “Tech” heading makes the column look symmetrical at the cost of being wrong. In the classic map, mid-cycle leadership concentrates in technology and high-beta growth. One leg.
This chart circulates widely and gets re-drawn often, and a few errors have been copied along with it. They are worth naming, because two of them would send you to a fund that does something other than what the label says.
The class column is the part that keeps working when the five-phase labelling gets blurry. It uses the standard split:
Note that energy appears in two consecutive phases, peak and slowdown. That overlap is real rather than sloppy, and it is a good reminder that leadership alone never pins the phase down precisely.
The instinctive way to use a table like this is to decide the phase and then look up the row. That is the direction that fools you, because you will pick the phase you already believe in.
The useful direction is the reverse: watch which of these is actually leading on a relative-strength basis, then let that tell you where in the cycle the market thinks it is. That reading is available every session and does not depend on a data release.
Where this sits in the terminal
The ROTATION panel in the Sharpnel desktop terminal ranks all eleven SPDR sector ETFs against SPY at 1-day, 5-day, 1-month, 3-month and 6-month horizons, sorts by one-month relative strength, and tags each row cyclical or defensive — then calls the tape risk-on, defensive or mixed based on which side holds the top half. Panel documentation.
Take this into the terminal
Reads the regime off sector and FX leadership rather than off a forecast, which is the direction this map is meant to be used in.
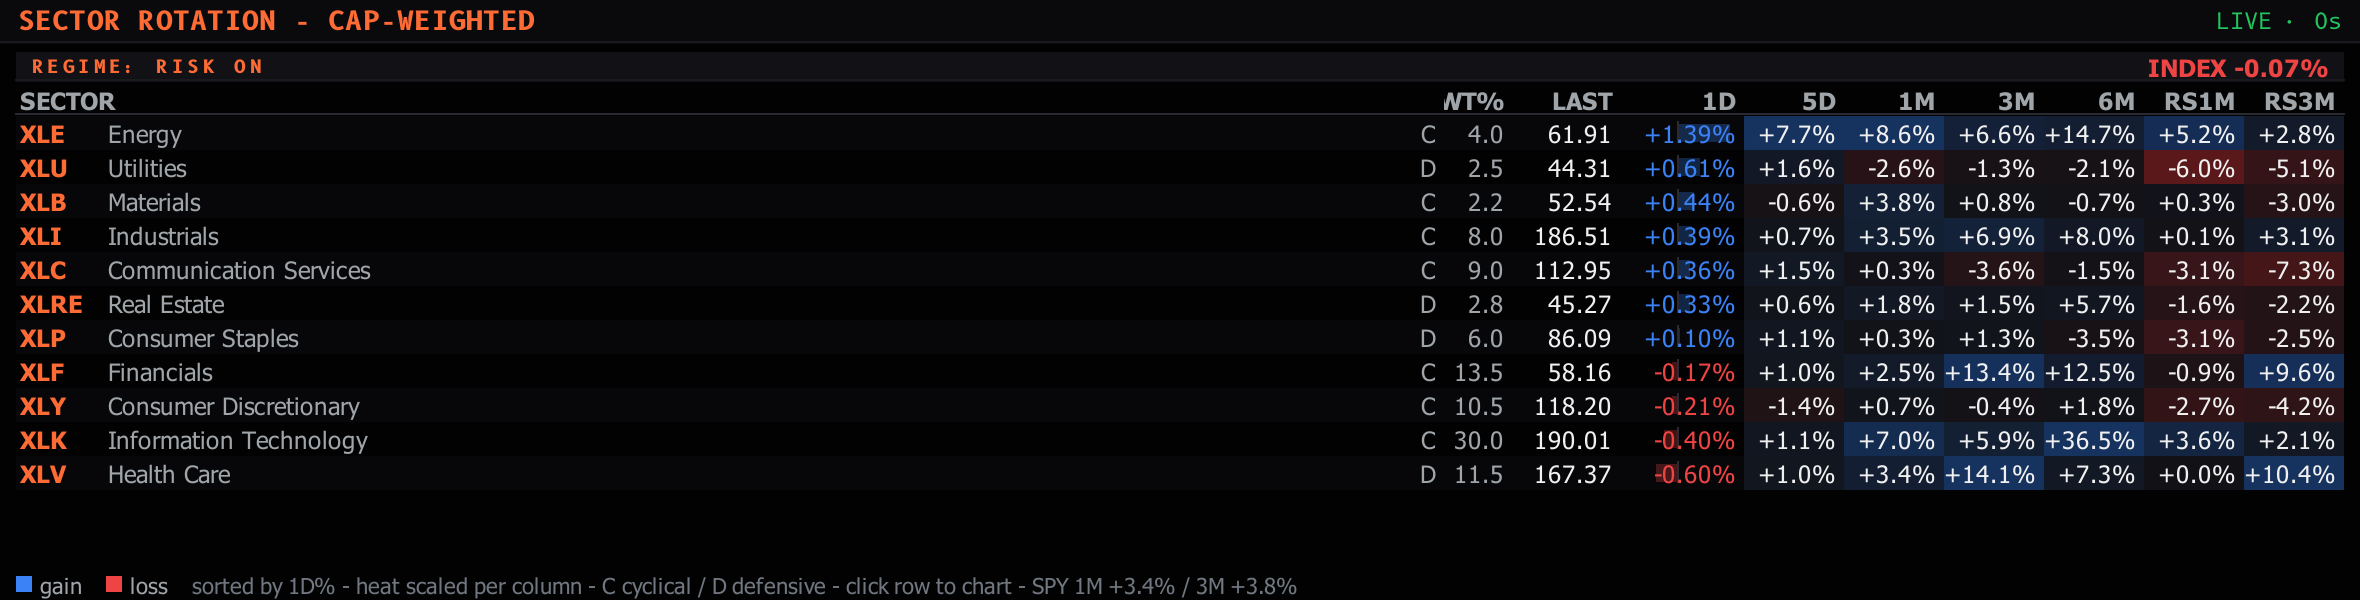
In this workspace
sector rotation·put call ratio·term structure
Worth adding — type add ⟨name⟩ in the palette
Presets sit in the strip under the menu bar — one click applies the whole layout, and every panel can be re-pointed at another symbol from its own header. How to run the Risk Monitor desk.
Published August 14, 2026 · Educational reference only. Nothing here is investment advice or a recommendation to buy or sell any security. Fund names and tickers are given to identify what tracks a sector, not to endorse one.
Today’s free read
The ES/NQ dealer-gamma map — the walls, the flip point, the regime — free every morning, yesterday’s levels graded in the open.