Macro · 29
The weekly cycle a CL trader runs on — API Tuesday, EIA Wednesday — plus the two numbers inside that report most people read backwards, and the macro layer that decides whether the inventory number matters at all.
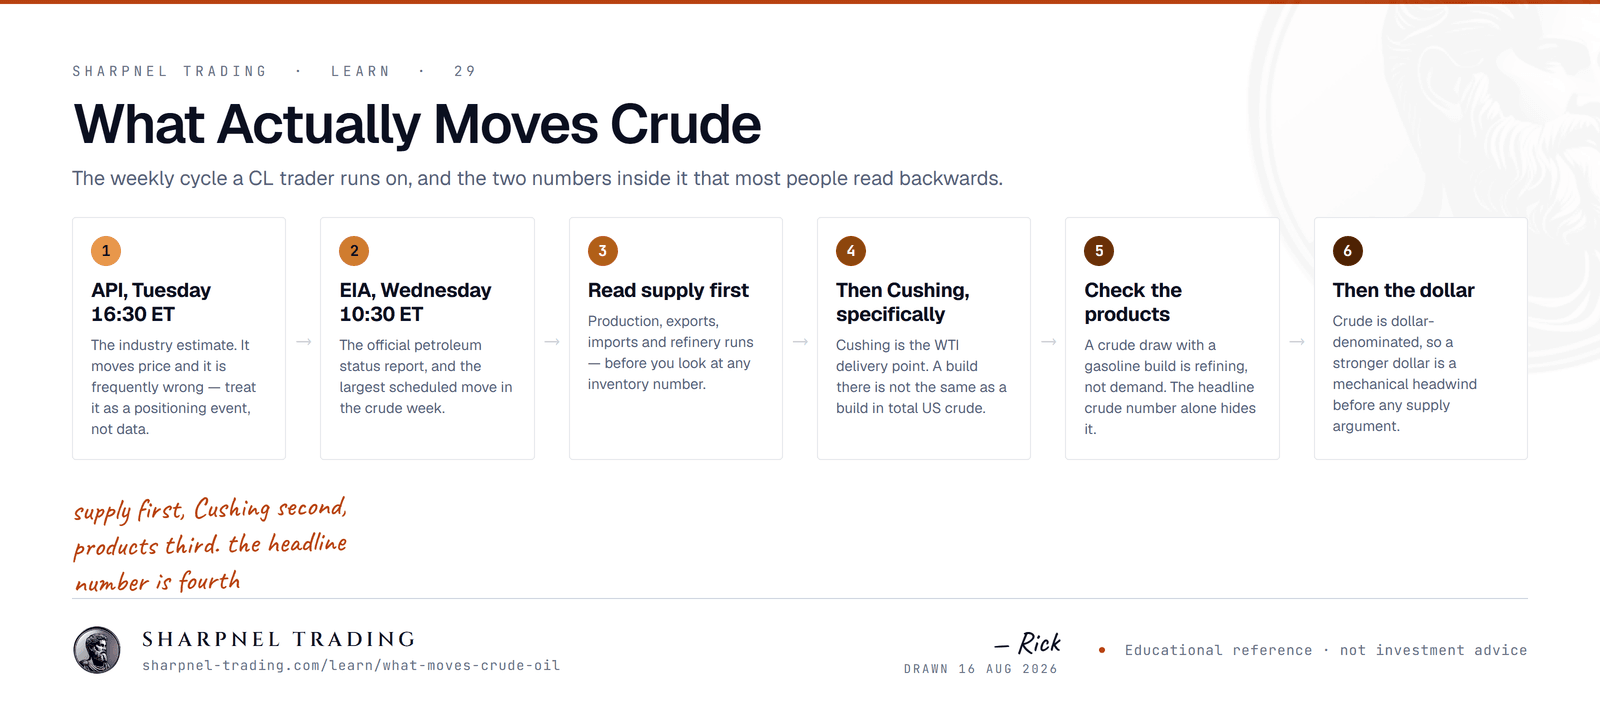
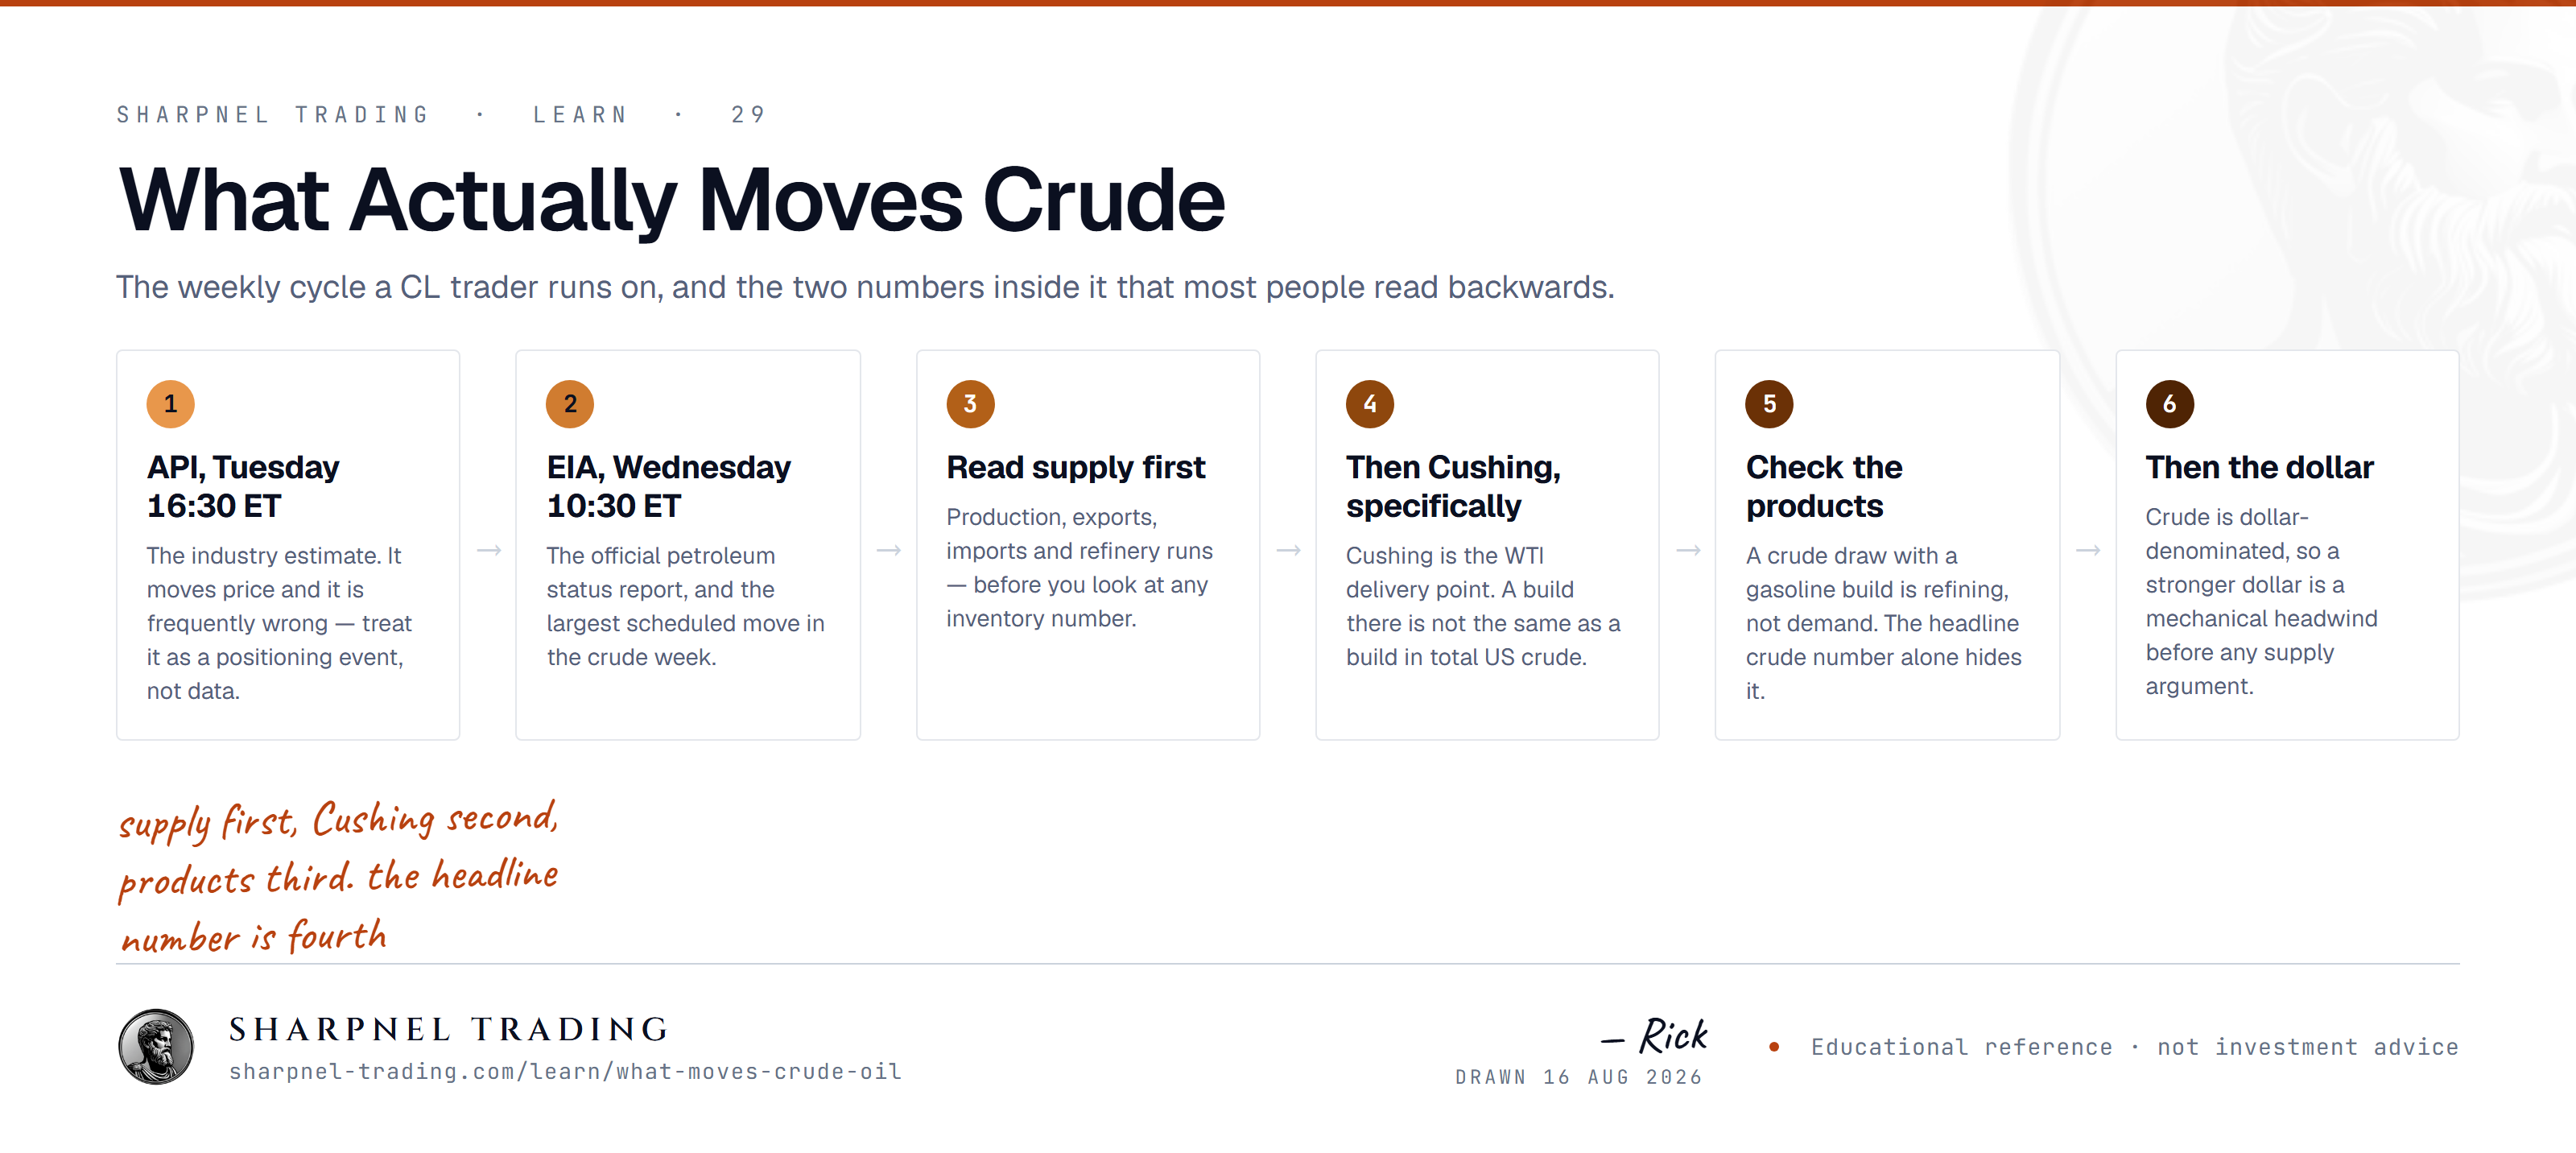
<a href="https://www.sharpnel-trading.com/learn/what-moves-crude-oil"><img src="https://www.sharpnel-trading.com/images/learn/what-moves-crude-oil-w1600.png" alt="A six-step weekly cycle for trading crude oil futures: the API estimate Tuesday 16:30 ET, the EIA petroleum status report Wednesday 10:30 ET, reading supply before inventories, checking Cushing as the WTI delivery point, comparing crude against product builds to separate refining from demand, and then the dollar." width="100%"></a><p>Via <a href="https://www.sharpnel-trading.com/learn/what-moves-crude-oil">Sharpnel Trading</a></p>
Crude has a rhythm that index futures do not. Two scheduled inventory releases a week, both at fixed times, and both capable of producing the largest move of the session on their own. Everything else — OPEC headlines, geopolitics, the dollar — is continuous and layers on top.
The mistake almost everyone makes
Supply first, then the delivery point, then the products. The headline number comes last, when you already know what produced it.
| Line | What it is | Why you read it here |
|---|---|---|
| Crude production | US output in millions of barrels per day. | Slow-moving and structural. A sustained change here outlives any inventory print. |
| Net imports / exports | What crossed the border this week. | Volatile and weather-affected. A closed Gulf port distorts the whole report. |
| Refinery utilisation | How much crude refiners actually processed. | The single best explanation for a surprise draw or build. Maintenance season moves it. |
| Cushing stocks | Inventory at the WTI delivery point in Oklahoma. | This is the number the front contract settles against. Total US crude is a different thing. |
| Gasoline stocks | Product inventory, the demand side. | A crude draw with a gasoline build means refining ran, not that anyone consumed more. |
| Distillate stocks | Diesel and heating oil. | The industrial and freight read. Tends to lead the economic story ahead of gasoline. |
The WTI contract is deliverable at Cushing, Oklahoma. That makes Cushing stocks the inventory number the front month actually settles against, and it can move in the opposite direction to national crude stocks for entirely mundane logistical reasons — pipeline scheduling, export economics, storage arbitrage. A national build with a Cushing draw is a bullish front-month configuration even though the headline says the opposite.
The crack spread is the margin a refiner earns turning crude into products. When crude draws down and gasoline stocks build in the same week, crude did not get consumed — it got converted. That is refinery activity, not end demand, and it has very different implications for what happens next. Refineries run seasonally and go into maintenance in spring and autumn; those windows produce inventory patterns that look like demand shocks and are not.
Distillates are the more honest demand signal of the two products. Diesel moves freight and industry, so distillate stocks tend to reflect the real economy earlier and more cleanly than gasoline, which is dominated by driving season.
Inventories tell you about this week. These tell you which direction the week's surprise gets amplified in.
| Driver | What it is | How it reaches the price |
|---|---|---|
| The dollar | Crude is priced in dollars worldwide. | A stronger dollar is a mechanical headwind before any supply argument is made. |
| OPEC+ policy | Announced quotas versus actual production. | The gap between the two matters more than the headline. Compliance is the real number. |
| Geopolitical premium | Risk to supply that has not happened yet. | Prices in fast and decays within days unless a barrel actually stops moving. |
| Term structure | Backwardation or contango across the strip. | Backwardation says the physical market is tight now. Contango pays people to store. |
| Brent–WTI spread | Waterborne versus landlocked pricing. | Widens when US export capacity is constrained or Cushing is oversupplied. |
| Global growth data | China PMI, freight, industrial production. | The demand side of the balance, and the slowest of all these to change direction. |
When the front month trades above the deferred months — backwardation — the physical market is paying a premium for barrels now. That is tightness expressed as a price, without anyone needing to publish a number. Contango is the reverse: the curve is paying people to store, which only happens when there is more crude around than anyone wants today. The shape changing is often earlier and more reliable than the inventory data that eventually confirms it.
Supply-risk headlines price in within minutes and then bleed off over days unless a physical barrel actually stops moving. The reason is straightforward: the premium is an insurance payment against a disruption, and every day without a disruption is a day of that insurance expiring worthless. Fading it is a recognised behaviour rather than a clever idea, which is exactly why the fade sometimes gets crowded and hurts.
The weekly report lines, the term structure and the dollar are all panels. The presets that put them together for a crude session:
The macro layer that sits above all of it — the dollar, growth, the rate path — is the same one described in what actually moves ES and NQ. And for the seasonal patterns underneath crude and the products, see commodity seasonality.
Retail gasoline prices are downstream and lag by weeks; they are a consequence, not an input. Long-range demand forecasts from agencies and banks move the narrative and rarely the price. Rig counts, published Fridays, are a genuine supply indicator on a multi-month horizon and almost never a same-day event. And a single OPEC minister making a statement is not a policy change — the production and export data is where you find out whether anything actually happened.
Take this into the terminal
The widest of the three energy layouts: the weekly report tables plus production and export flows by country, which is where an OPEC+ headline turns into a number you can check.
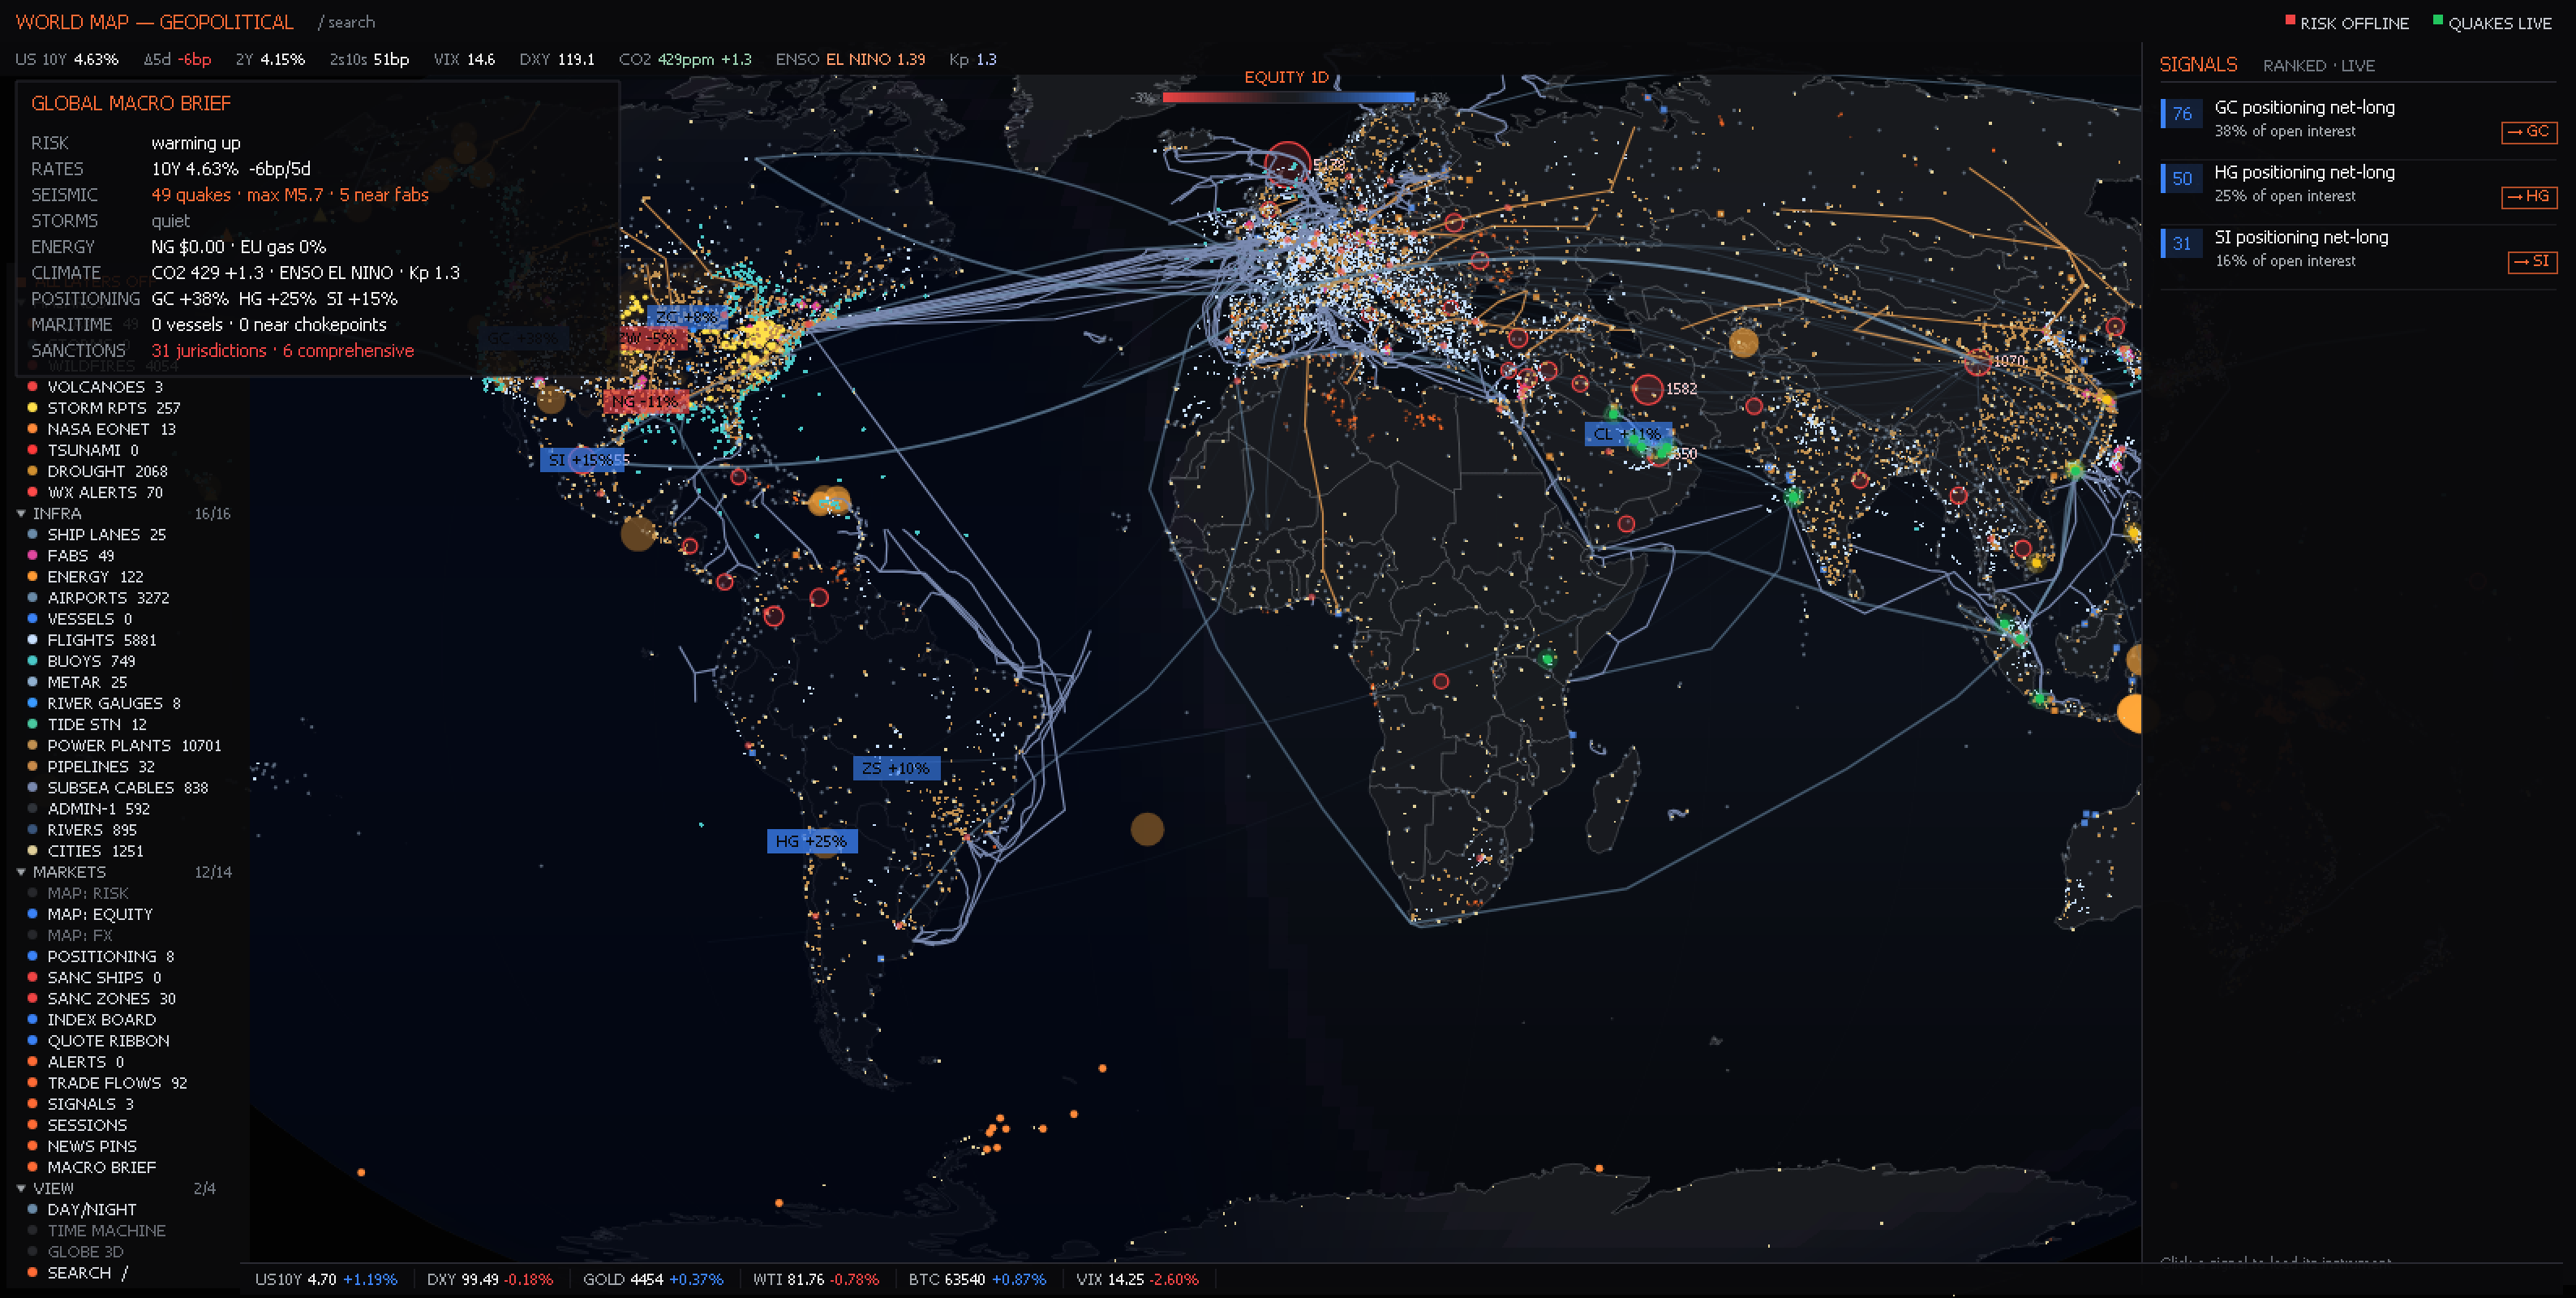
In this workspace
Worth adding — type add ⟨name⟩ in the palette
Presets sit in the strip under the menu bar — one click applies the whole layout, and every panel can be re-pointed at another symbol from its own header. How to run the Energy Geo desk.
Published August 15, 2026 · Educational reference only. Nothing here is investment advice or a recommendation to buy or sell any security. Fund names and tickers are given to identify what tracks a sector, not to endorse one.
Today’s free read
The ES/NQ dealer-gamma map — the walls, the flip point, the regime — free every morning, yesterday’s levels graded in the open.