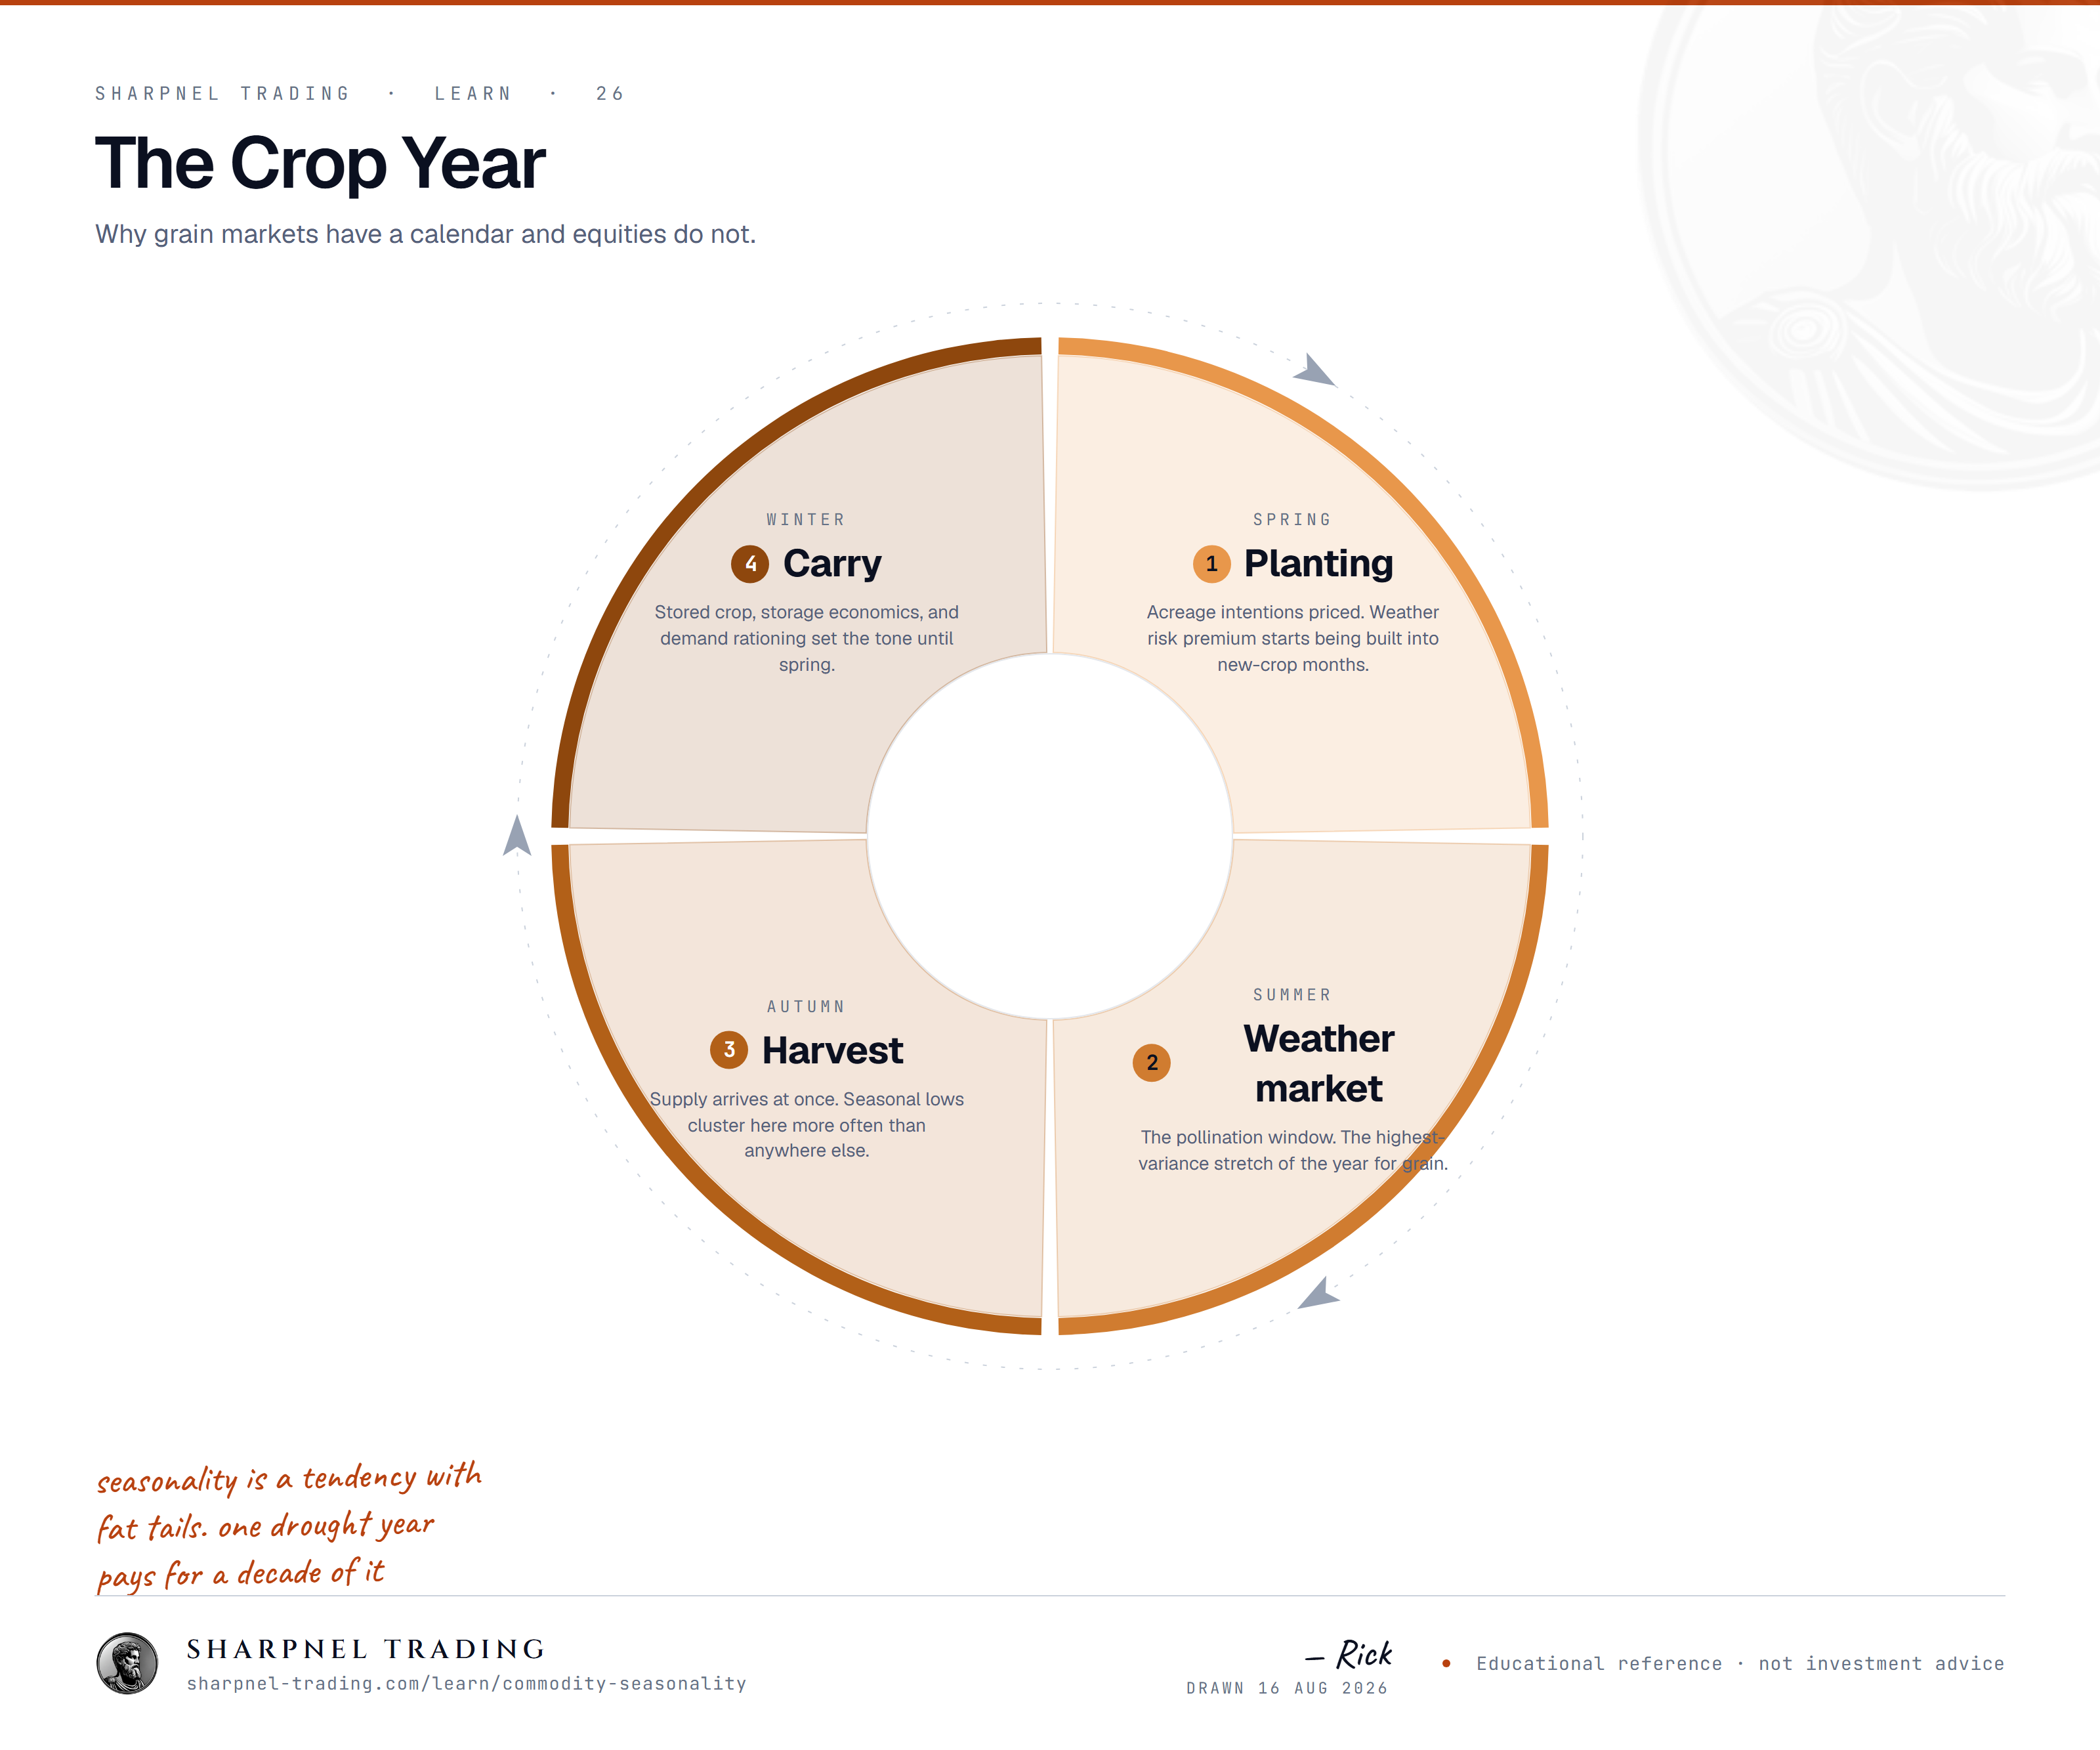
Commodity seasonality is the tendency of certain futures markets to repeat price behavior at the same time each year, because the physical world that produces and consumes raw materials runs on a calendar. Corn is planted in spring and harvested in fall. Natural gas flows into storage all summer and out of it all winter. Refineries retool in spring ahead of driving season. These cycles are physical facts, and they leave measurable fingerprints on everything from the shape of the forward curve to the volatility around a crop report.
The catch is that the tradeable part is smaller than the seasonal-chart vendors suggest. Much of what gets published as a "seasonal pattern" is a data-mining artifact, and the part that is real tends to show up in the futures curve long before it shows up in a trade. What follows: where the genuine cycles come from, how seasonal statistics are built, the ways those statistics lie, and why seasonality earns its keep in preparation rather than prediction.
The physical cycles underneath the charts
Grains run on the crop calendar
Take US corn as the template. Planting runs roughly April into May. Pollination — the July window where yield is largely decided — is the most weather-sensitive stretch of the year. Harvest arrives September through November, when a year's supply hits the market in the space of a few weeks.
That calendar produces recognizable behavior. Uncertainty about yield builds a weather premium into prices during early summer; if pollination weather cooperates, the premium bleeds back out, which is why old grain hands talk about summer highs decaying into harvest lows. At harvest, elevators fill and growers without storage must sell at whatever the market pays. Afterward a carry market often develops: deferred contracts trade above nearby ones by roughly the cost of storing grain, paying commercial firms to hold it off the market.
The contract months encode all of this. July corn prices last year's crop sitting in bins; December corn prices a crop that may still be in the ground. They are related but distinct markets, and a seasonal study that blurs old-crop and new-crop contracts together is measuring noise. Soybeans follow a similar script with the weather-critical window shifted into August, when pods fill. Winter wheat inverts part of the pattern, coming out of the fields in early summer.
Energy runs on heating and driving
Natural gas has the cleanest demand calendar in futures. From roughly April through October, more gas is produced than burned and the surplus is injected into storage; from November through March, heating demand pulls it back out. A hot summer adds a second demand spike through power burn for air conditioning. The soft spots are the shoulder months of spring and fall, when neither furnaces nor air conditioners are working hard.
Petroleum products keep their own schedule. Gasoline demand peaks with summer driving, and refiners transition to summer-blend specifications in the spring. Spring is also turnaround season, when refineries schedule maintenance and crude runs dip. Heating oil demand concentrates in winter. None of this is secret — which matters more than most seasonal writeups admit, as we'll get to.
How seasonal statistics are built
A seasonal chart is an average, and every choice made in building it shapes what you see:
- Pick a lookback — 15 and 30 years are the common conventions.
- Normalize each year so different price regimes are comparable. Analysts either index each year to a starting value or work in percent changes; averaging raw prices lets one high-priced year dominate the whole picture.
- Average across years, day by day, to produce the seasonal path, usually summarized with a window win rate ("higher on date X than date Y in 12 of the last 15 years").
Survivorship and the data-mined pattern
Fifteen years of annual observations is a sample of fifteen. That is the core statistical problem, and it compounds:
- Window mining. Scan a few hundred entry-and-exit date combinations across a handful of markets and chance alone will hand you several windows with 12-of-15 records. Publishers show you the survivors; the graveyard of windows that stopped working is not in the brochure. Date precision like "enter February 14, exit March 23" is itself the tell — no physical cycle respects exact calendar dates, because weather shifts the crop and heating calendars every single year.
- Regime change. The shale build-out rewired the supply side of North American natural gas; a lookback that averages the pre-shale and post-shale eras describes a market that no longer exists in either form. South America's soybean expansion put a second harvest — roughly February through May — on the world calendar and muted the old northern-hemisphere pattern. Ethanol policy changed corn's demand profile in the mid-2000s. A long seasonal average silently spans all of these breaks.
- Universe survivorship. Screens that rank "the best seasonal trades this month" across dozens of markets are re-selecting winners every cycle. The screen's glowing historical record is not a record any single trader could have held.
The forward curve already knows
Here is the part that kills naive seasonal trading. Predictable cycles get embedded in the curve itself. Say it is June and natural gas for July delivery trades at a hypothetical $2.90 while the January contract trades at $3.55. That 65-cent winter premium is not a prediction you can collect by buying January — it is the market charging in advance for heating demand plus the cost of carrying gas from summer into winter. Going long the winter contract because "winter is bullish for gas" earns nothing unless the winter turns out colder, or supply tighter, than the premium already implies. If the winter comes in mild, January falls back toward the rest of the curve and the position loses even though the seasonal pattern "happened" — heating demand did rise, exactly as it does every year.
The honest formulation: a seasonal position is a bet on deviation from the embedded cycle, not on the cycle itself. Which is why practitioners anchor to state variables rather than the calendar — storage inventories versus their five-year average, crop condition ratings versus history — because those measure how this year differs from the average the curve has already absorbed.
Context, not signal
So what is seasonality for? Used well, it works like a weather forecast: it changes what you are prepared for, not what you do at the moment of execution.
- A volatility calendar. Seasonality times event risk better than it times price. Grain options price the July pollination window; gas traders organize the week around the Thursday storage report; monthly supply-and-demand reports move grains regardless of what the seasonal path says. Knowing when the market's attention concentrates is the reliable part.
- A regime map. Knowing that weather premium tends to build into early summer and drain out afterward tells you which direction surprises will hit hardest, and when a quiet market is coiled rather than dead.
- A filter, never a trigger. A harvest-lows tendency only interests me when the market is visibly building acceptance down there — price holding a value area, real buying showing up in order flow at the lows. I treat the seasonal overlay the way I treat the forecast before a session: it sets expectations, never entries.
The calendar is real. The crops do come in; the furnaces do come on. But the market knows the calendar too, and the curve charges admission for it. Treat every published seasonal pattern as data-mined until you can name its physical mechanism and show that this year's state variables genuinely diverge from what the curve has already priced.