Refinery/LNG/fab infrastructure map over the physical-power grid, inventories, a crude/gas chart and energy-futures positioning
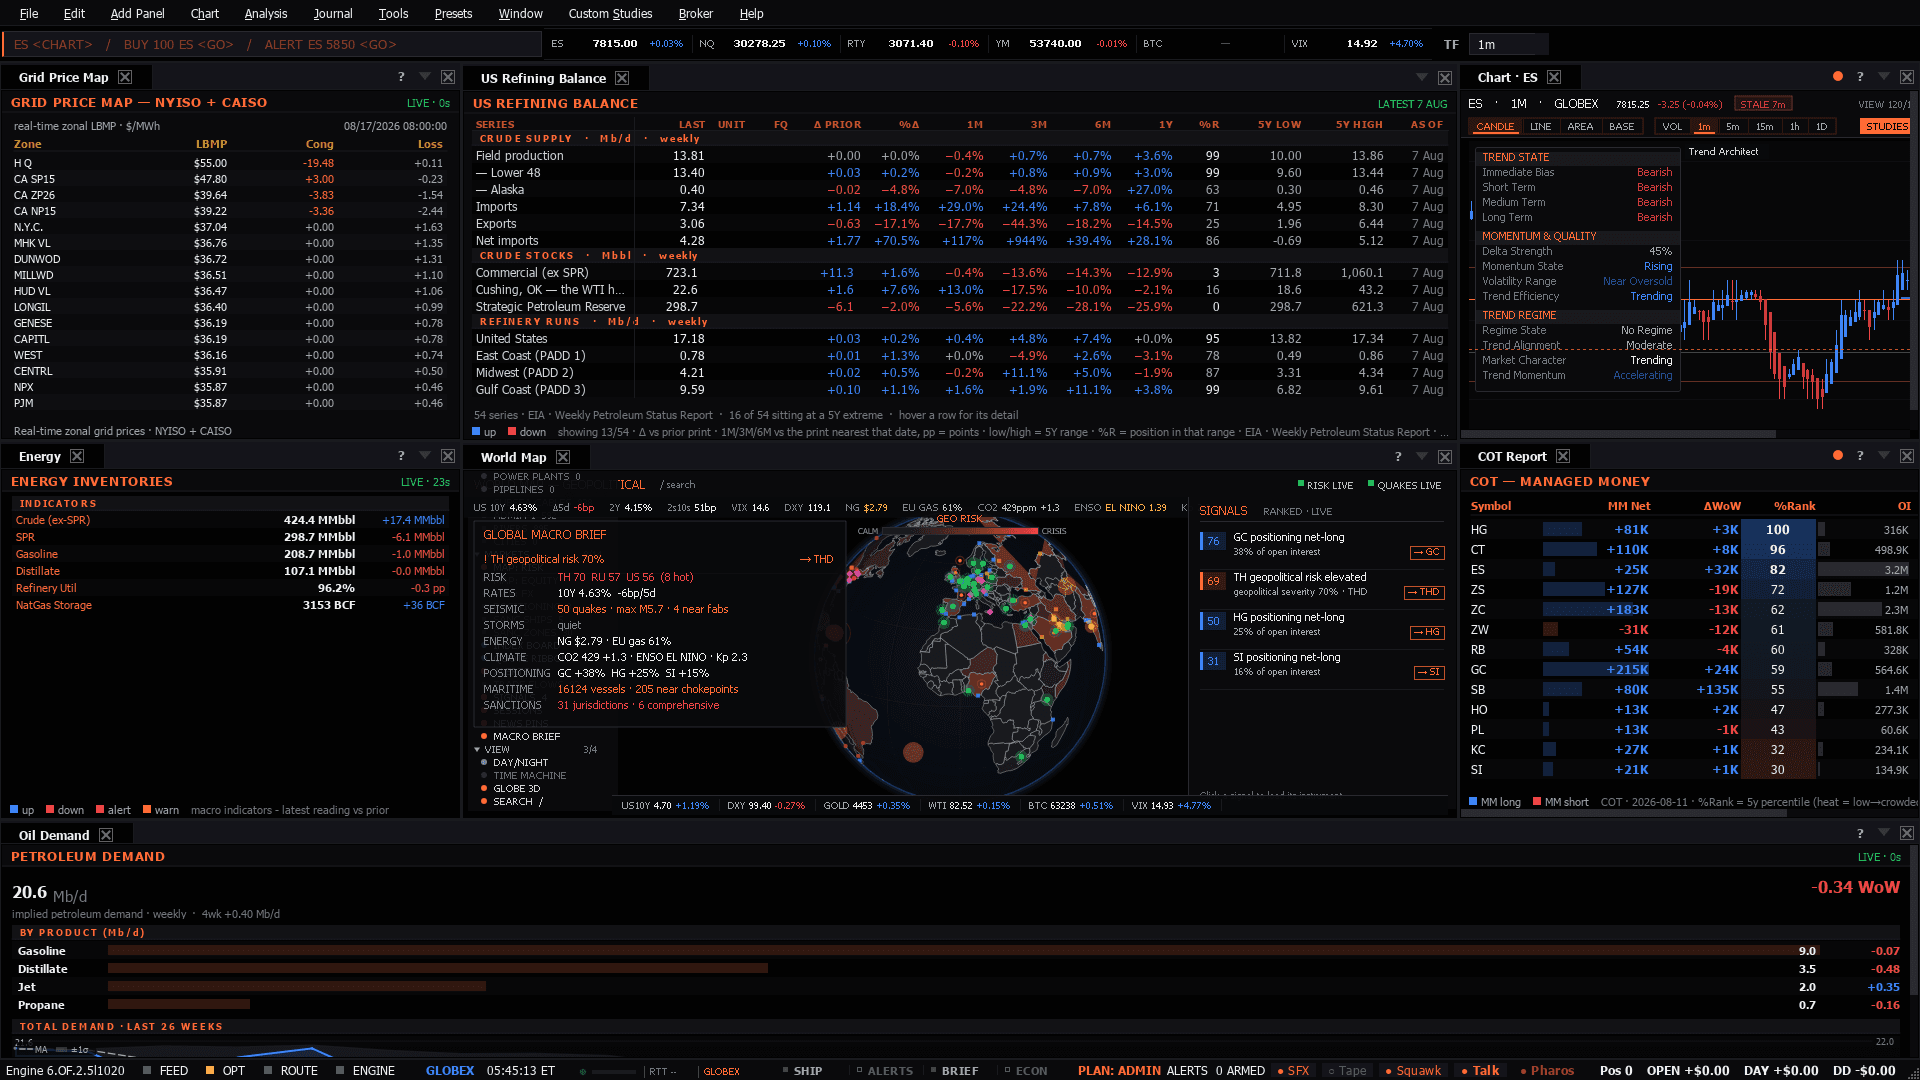
Refinery/LNG/fab infrastructure map over the physical-power grid, inventories, a crude/gas chart and energy-futures positioning
Use it when: When the energy story is about infrastructure or geography rather than inventory.
Infrastructure and geography - refineries, LNG terminals, and where capacity physically sits.
Only for a supply shock large enough to reach the inflation path.
Same, further removed.
Supply risk is the crude trader's main use of a map. The question is not whether an event happened, but whether positioning has already moved for it.
Presets in the menu bar, under the category this desk belongs to — one click applies the whole layout, and a checkmark tracks which one is active.Ctrl+P, which finds it by name.Add Panel menu.The tell: Infrastructure risk is slow until it is not. The map is context; the positioning tells you what is already in the price.
6 panels, read straight from the preset definition in the desktop build:
Plus 1 dense sheet — wide tables that carry a whole complex in one upstream call rather than a wall of single-series tiles:
These desks assume the theory. If any of it is unfamiliar, the background reading is on the learn side:
