Physical-power + energy cockpit: the real-time Grid Price Map (NYISO + CAISO zonal LMP, client-side BYOD) as the hero, with EIA inventories, energy-futures COT positioning, a chart for the crude/gas complex, and macro context
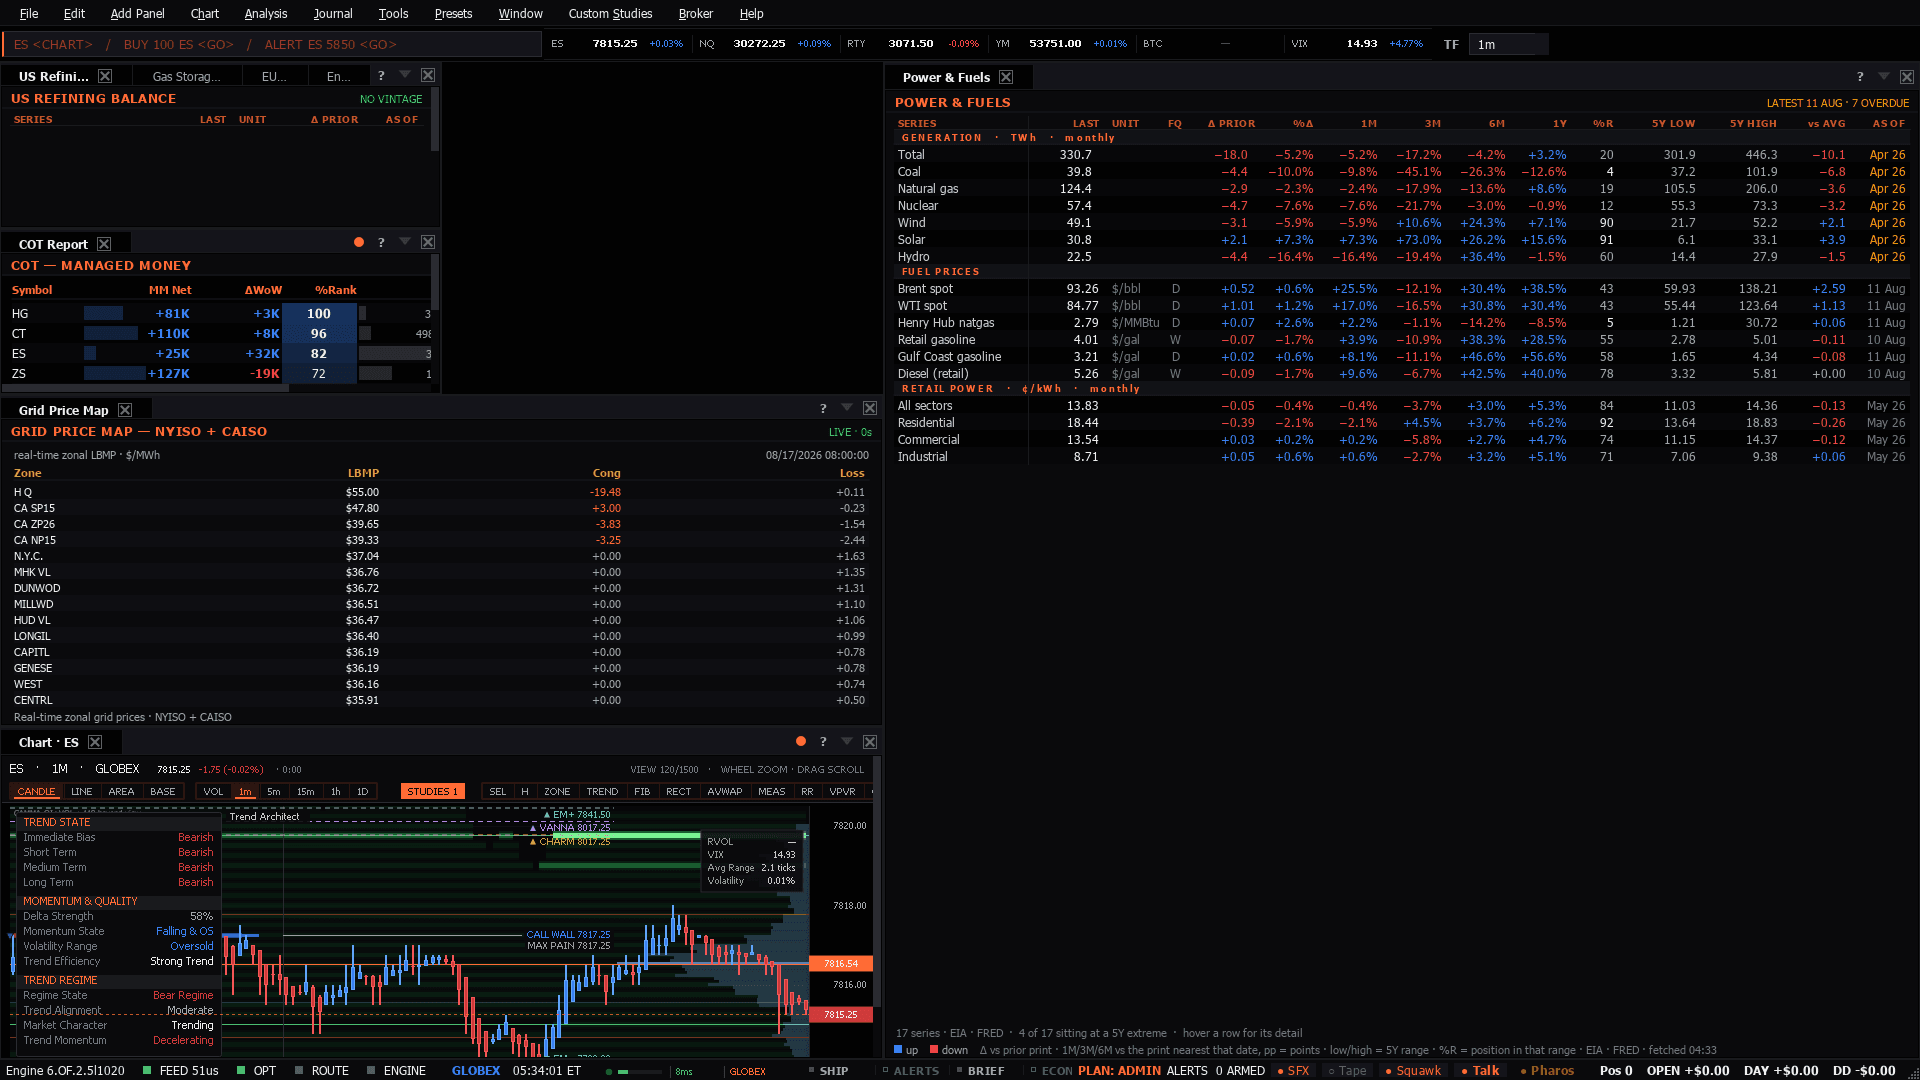
Physical-power + energy cockpit: the real-time Grid Price Map (NYISO + CAISO zonal LMP, client-side BYOD) as the hero, with EIA inventories, energy-futures COT positioning, a chart for the crude/gas complex, and macro context
Use it when: When physical power is the story rather than the futures curve.
When the physical market is the story rather than the futures curve - grid constraints, inventories and positioning together.
Indirect, through the energy sector and utility costs.
Marginal.
Zonal price separation on the grid map is a constraint made visible. Read it beside inventories and COT positioning: a supply constraint positioning has already priced is not the trade it appears to be.
Presets in the menu bar, under the category this desk belongs to — one click applies the whole layout, and a checkmark tracks which one is active.Ctrl+P, which finds it by name.show me natural gas.Add Panel menu.The tell: Zonal price separation is the constraint. A single national number hides it entirely.
4 panels, read straight from the preset definition in the desktop build:
Plus 4 dense sheets — wide tables that carry a whole complex in one upstream call rather than a wall of single-series tiles:
These desks assume the theory. If any of it is unfamiliar, the background reading is on the learn side:
