The rates & curve + CPI sheets lead the center with the World Map tabbed beside them; Breadth + Internals left, Macro Dashboard + Yield Curve right, Sector Treemap + Econ Calendar + FX bottom
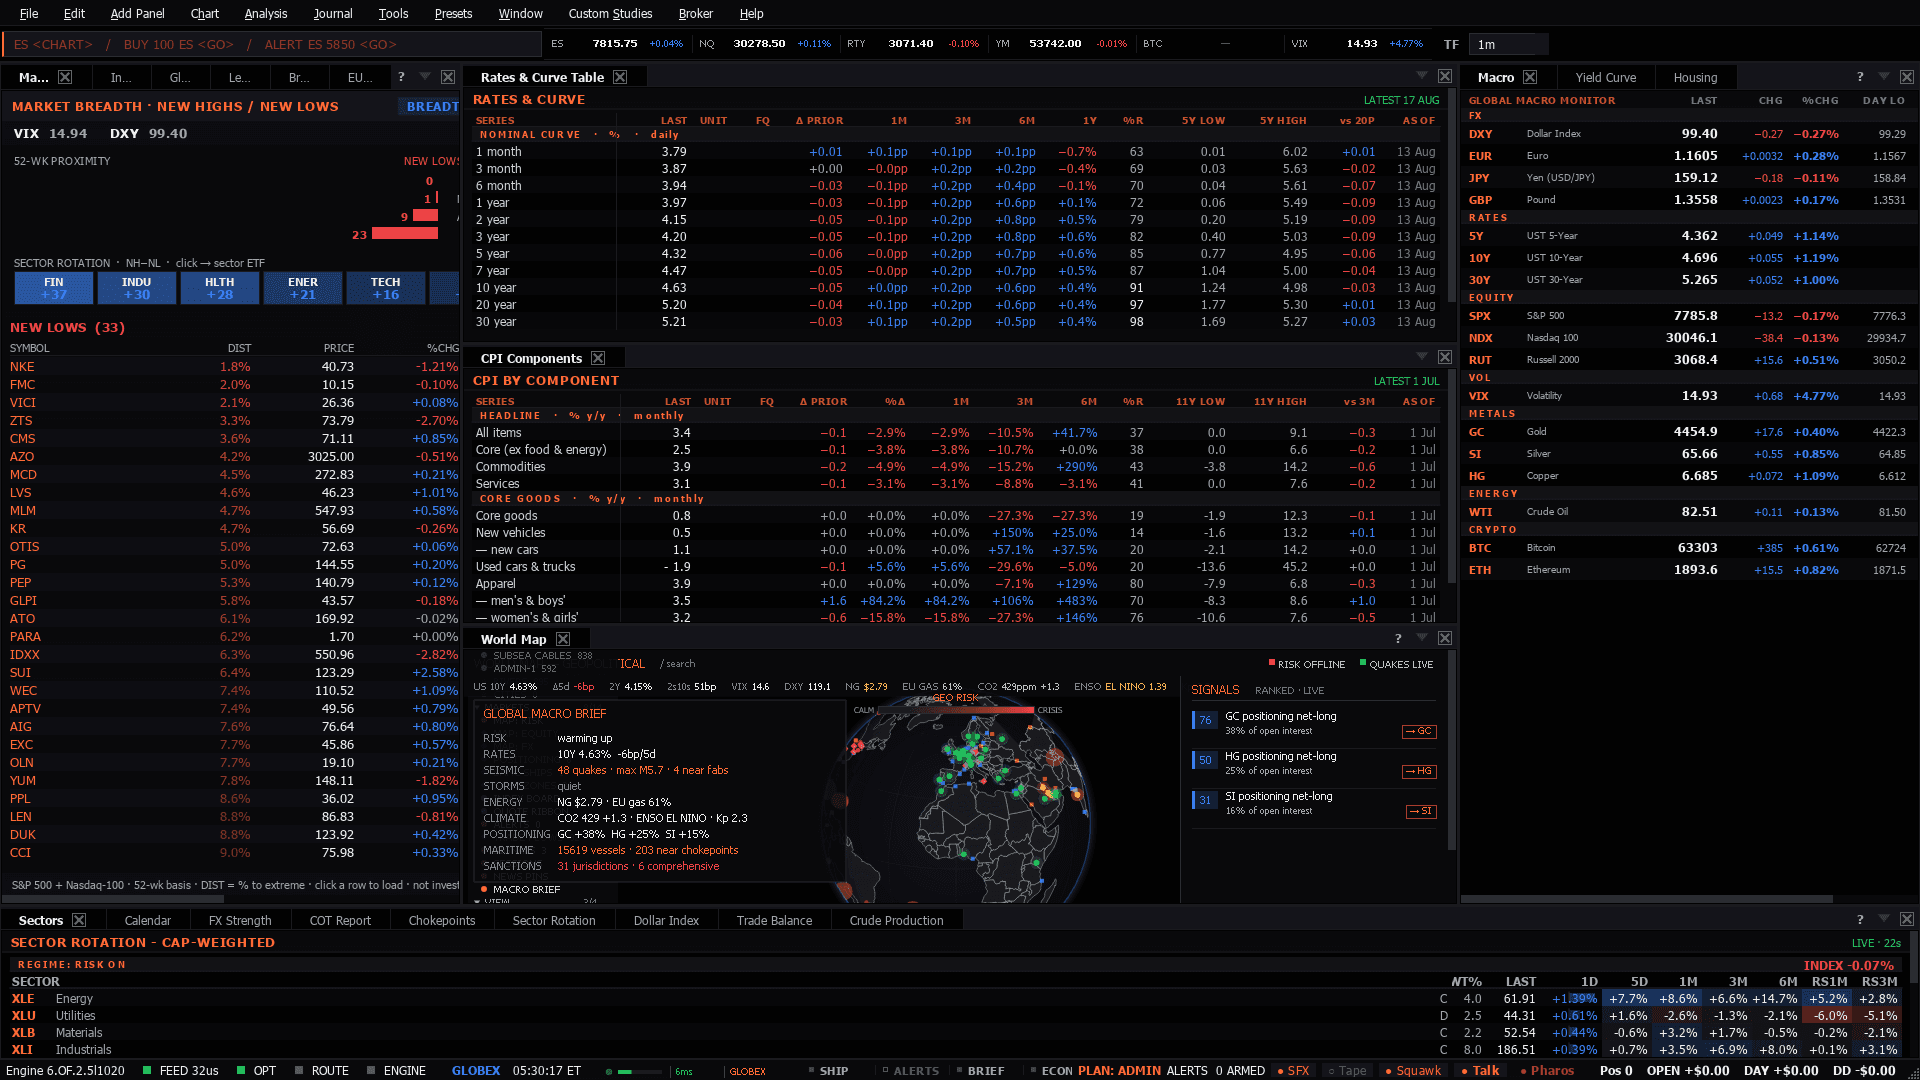
The rates & curve + CPI sheets lead the center with the World Map tabbed beside them; Breadth + Internals left, Macro Dashboard + Yield Curve right, Sector Treemap + Econ Calendar + FX bottom
Use it when: The broad daily sweep — one screen that answers what moved and why.
The daily sweep. Use it to find which macro question is driving the session before deciding how to trade ES, NQ or CL.
Read the curve and breadth together. An index move breadth does not confirm is a move led by a handful of names.
Watch sector leadership specifically - NQ's fate is decided by whether technology is leading or lagging the complex.
The FX row is your line into crude here: the dollar is the fastest macro transmission into the crude price.
Presets in the menu bar, under the category this desk belongs to — one click applies the whole layout, and a checkmark tracks which one is active.Ctrl+P, which finds it by name.show me macro.Add Panel menu.The tell: Use it to find the question, not the answer. When one panel disagrees with the rest, that is where to go deeper.
16 panels, read straight from the preset definition in the desktop build:
Plus 5 dense sheets — wide tables that carry a whole complex in one upstream call rather than a wall of single-series tiles:
These desks assume the theory. If any of it is unfamiliar, the background reading is on the learn side:
