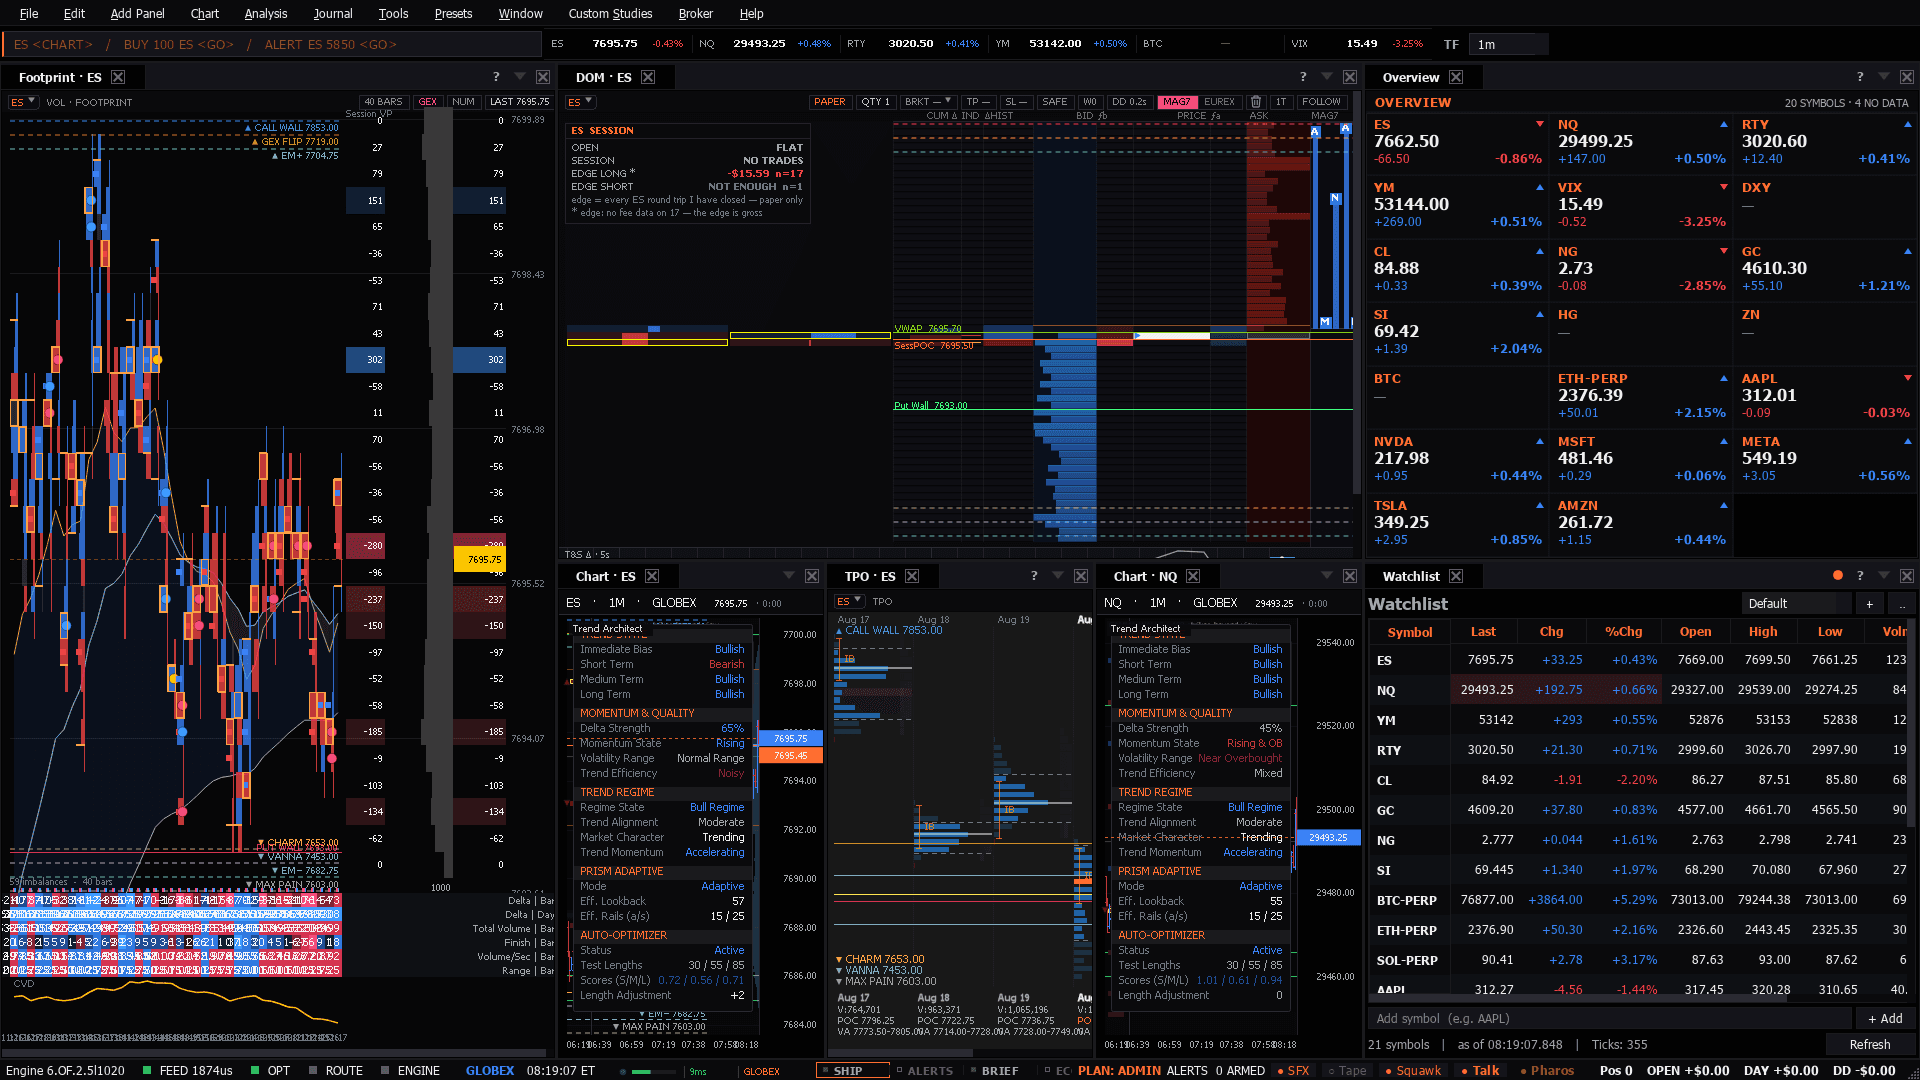
3-column day-trading cockpit: a Footprint chart on the LEFT, the order-flow DOM big in the CENTER with an ES 1-min chart (POC + GEX), the TPO profile, and an NQ liquidity heatmap below it, multi-symbol Overview over the Watchlist on the RIGHT. Click a panel's header symbol to re-point it.
3-column day-trading cockpit: a Footprint chart on the LEFT, the order-flow DOM big in the CENTER with an ES 1-min chart (POC + GEX), the TPO profile, and an NQ liquidity heatmap below it, multi-symbol Overview over the Watchlist on the RIGHT. Click a panel's header symbol to re-point it.
Use it when: A session where you are trading one instrument but need a second one in view, or watching for the two to diverge.
A three-column cockpit for trading two instruments at once - the book in the middle, the footprint beside it, and the multi-symbol grid keeping the rest of the complex in view.
Centre column is ES: the ladder, the 1-minute chart with POC and gamma, the TPO profile underneath.
The second instrument. Watching an NQ liquidity heatmap next to an ES ladder is how you catch the complex splitting before either chart shows it.
Re-point any panel from its header. Nothing on this desk is hard-wired to the index complex except the gamma overlay.
Presets in the menu bar, under the category this desk belongs to — one click applies the whole layout, and a checkmark tracks which one is active.Ctrl+P, which finds it by name.Add Panel menu.The tell: Two instruments that normally move together separating - one holding a level while the other gives it up - is either the start of a real rotation or a stretched spread. The overview column is what makes you notice it in the first place.
5 panels, read straight from the preset definition in the desktop build:
These desks assume the theory. If any of it is unfamiliar, the background reading is on the learn side:
