VIX term structure (the curve) as the hero over Put/Call, the chain-derived IV Surface over the realized-vol cone left, and dealer gamma over the policy stream right — implied vol beside positioned vol, with the macro-event docket one tab away
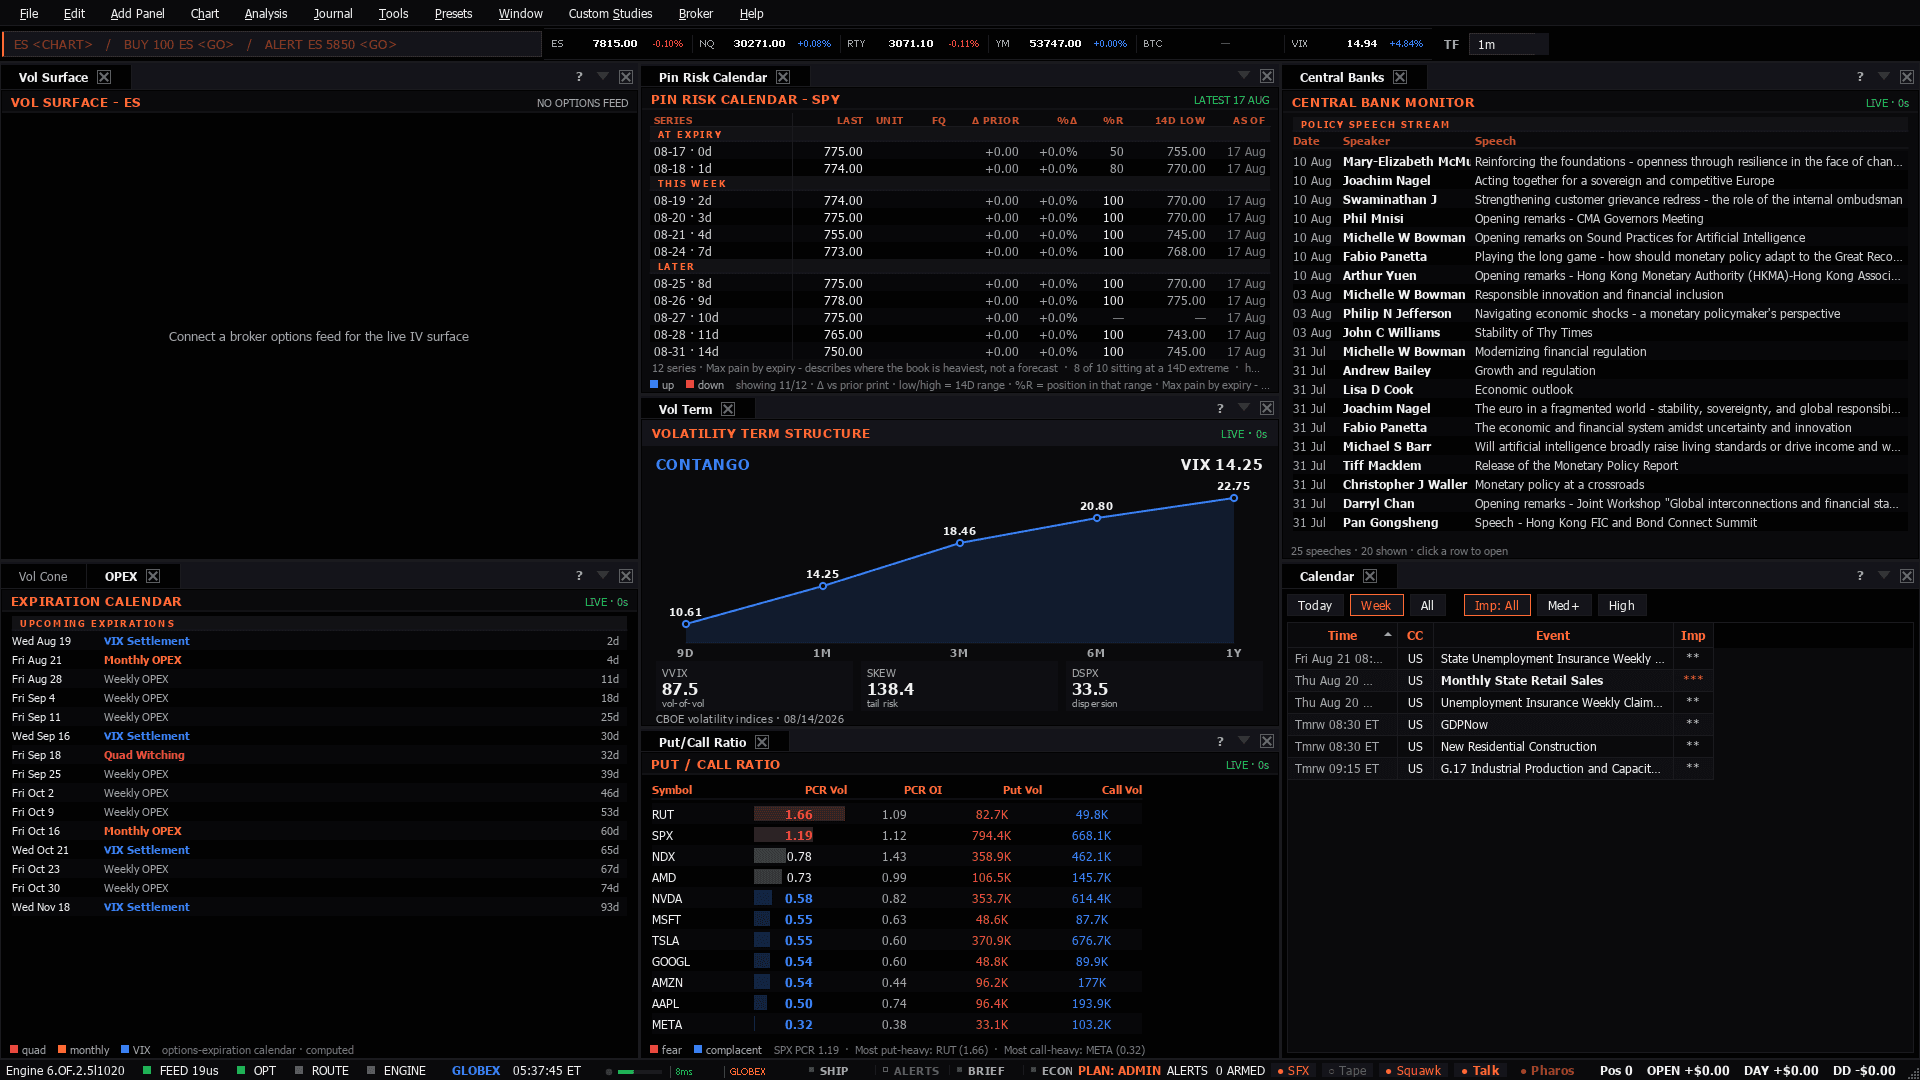
VIX term structure (the curve) as the hero over Put/Call, the chain-derived IV Surface over the realized-vol cone left, and dealer gamma over the policy stream right — implied vol beside positioned vol, with the macro-event docket one tab away
Use it when: Expiry weeks, and any session where the vol complex is moving more than the index it is written on.
Volatility is the price of the hedge, and the shape of the curve is the market telling you whether it is worried about today or about next month. Both index futures trade differently depending on which.
An inverted front month means protection is being bought right now, and ES ranges compress into it before they expand out of it. The pin-risk calendar is the other half: on a big expiry, strikes with size behave like magnets into the settle.
NQ carries the higher implied vol of the two, so the same curve shape gives you a wider expected range. Read the cone for whether realised has caught up to implied or is still lagging.
Crude has its own vol surface and its own expiry calendar; this desk is built around the index complex.
Presets in the menu bar, under the category this desk belongs to — one click applies the whole layout, and a checkmark tracks which one is active.Ctrl+P, which finds it by name.show me volatility.Add Panel menu.The tell: Implied rising while realised sits still is somebody paying up for protection ahead of something. The gap between the two is the trade the whole desk is arranged to show.
8 panels, read straight from the preset definition in the desktop build:
Plus 1 dense sheet — wide tables that carry a whole complex in one upstream call rather than a wall of single-series tiles:
These desks assume the theory. If any of it is unfamiliar, the background reading is on the learn side:
