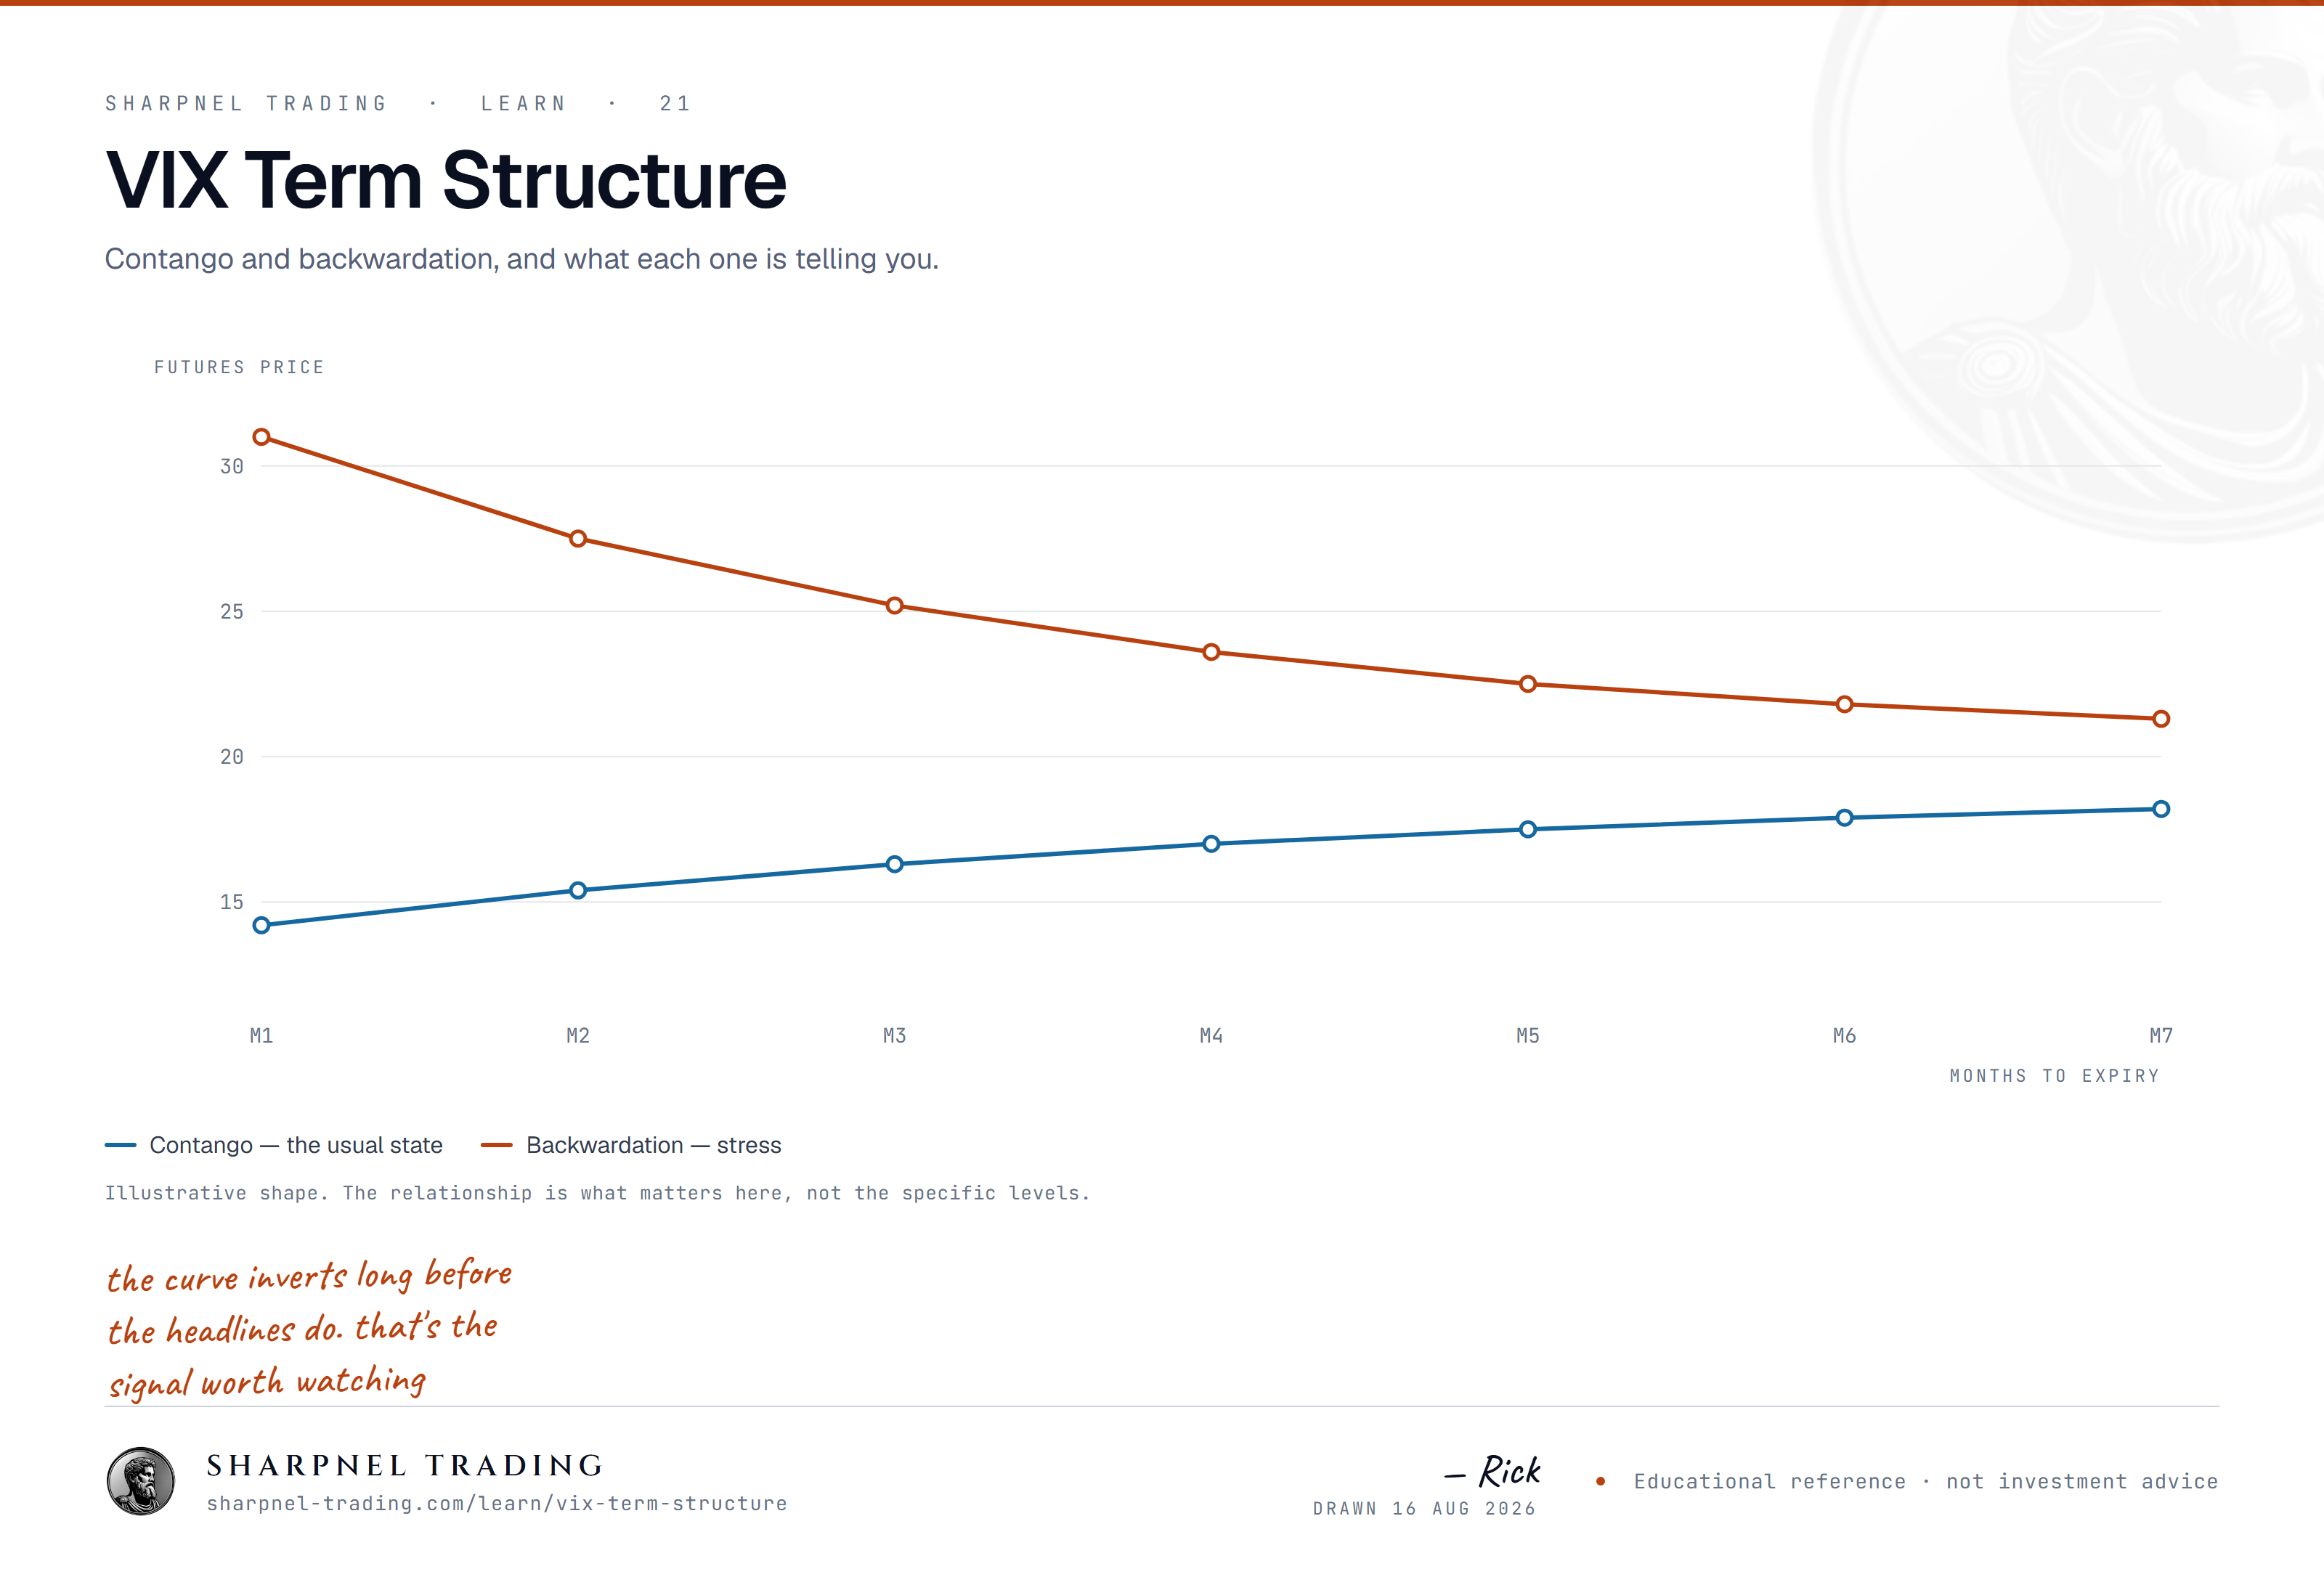
The VIX term structure is the curve you get by lining up VIX futures prices in order of expiration. When deferred months trade above spot VIX, the curve slopes upward — contango, the market's default state. When futures trade below spot, the curve inverts into backwardation, the configuration that appears around selloffs and volatility shocks. The slope answers a specific question: what is the options market paying today for volatility delivered next month versus three months out?
That slope matters more than the spot VIX print most traders quote, because spot VIX is not a tradable instrument. It is an index — a formula output computed from SPX option prices — and nothing in your account can hold it directly. Every instrument anyone actually trades in the VIX complex — VX futures and the products built on them — lives somewhere on the term structure, not at the spot point. If you trade ES or SPX options, the shape of this curve is background radiation for your whole session.
How the curve is built
Spot VIX measures 30-day expected volatility of the S&P 500. Cboe computes it from a strip of out-of-the-money SPX options, using expirations roughly 23 to 37 days out and interpolating to a constant 30-day horizon. Note what that excludes: 0DTE options never enter the calculation, which helps explain sessions where intraday swings are violent yet spot VIX barely reacts.
VX futures are cash-settled contracts on where that index will stand on a future settlement date. The standard contract is worth $1,000 per index point and settles to a Special Opening Quotation derived from the opening prices of SPX options, normally on a Wednesday morning; a mini version trades at $100 per point. Monthly expirations list several months deep, with weekly expirations filling gaps near the front. Plot each contract's price against its settlement date and the resulting curve is the term structure.
One structural point that trips up newer traders: VIX options do not track spot VIX either. Each VIX option expiry is European-style and cash-settled, and it prices off its matching future. When spot VIX jumps four points and your VIX calls barely move, the future they reference likely moved far less — that is the term structure absorbing the shock.
Contango: the default shape
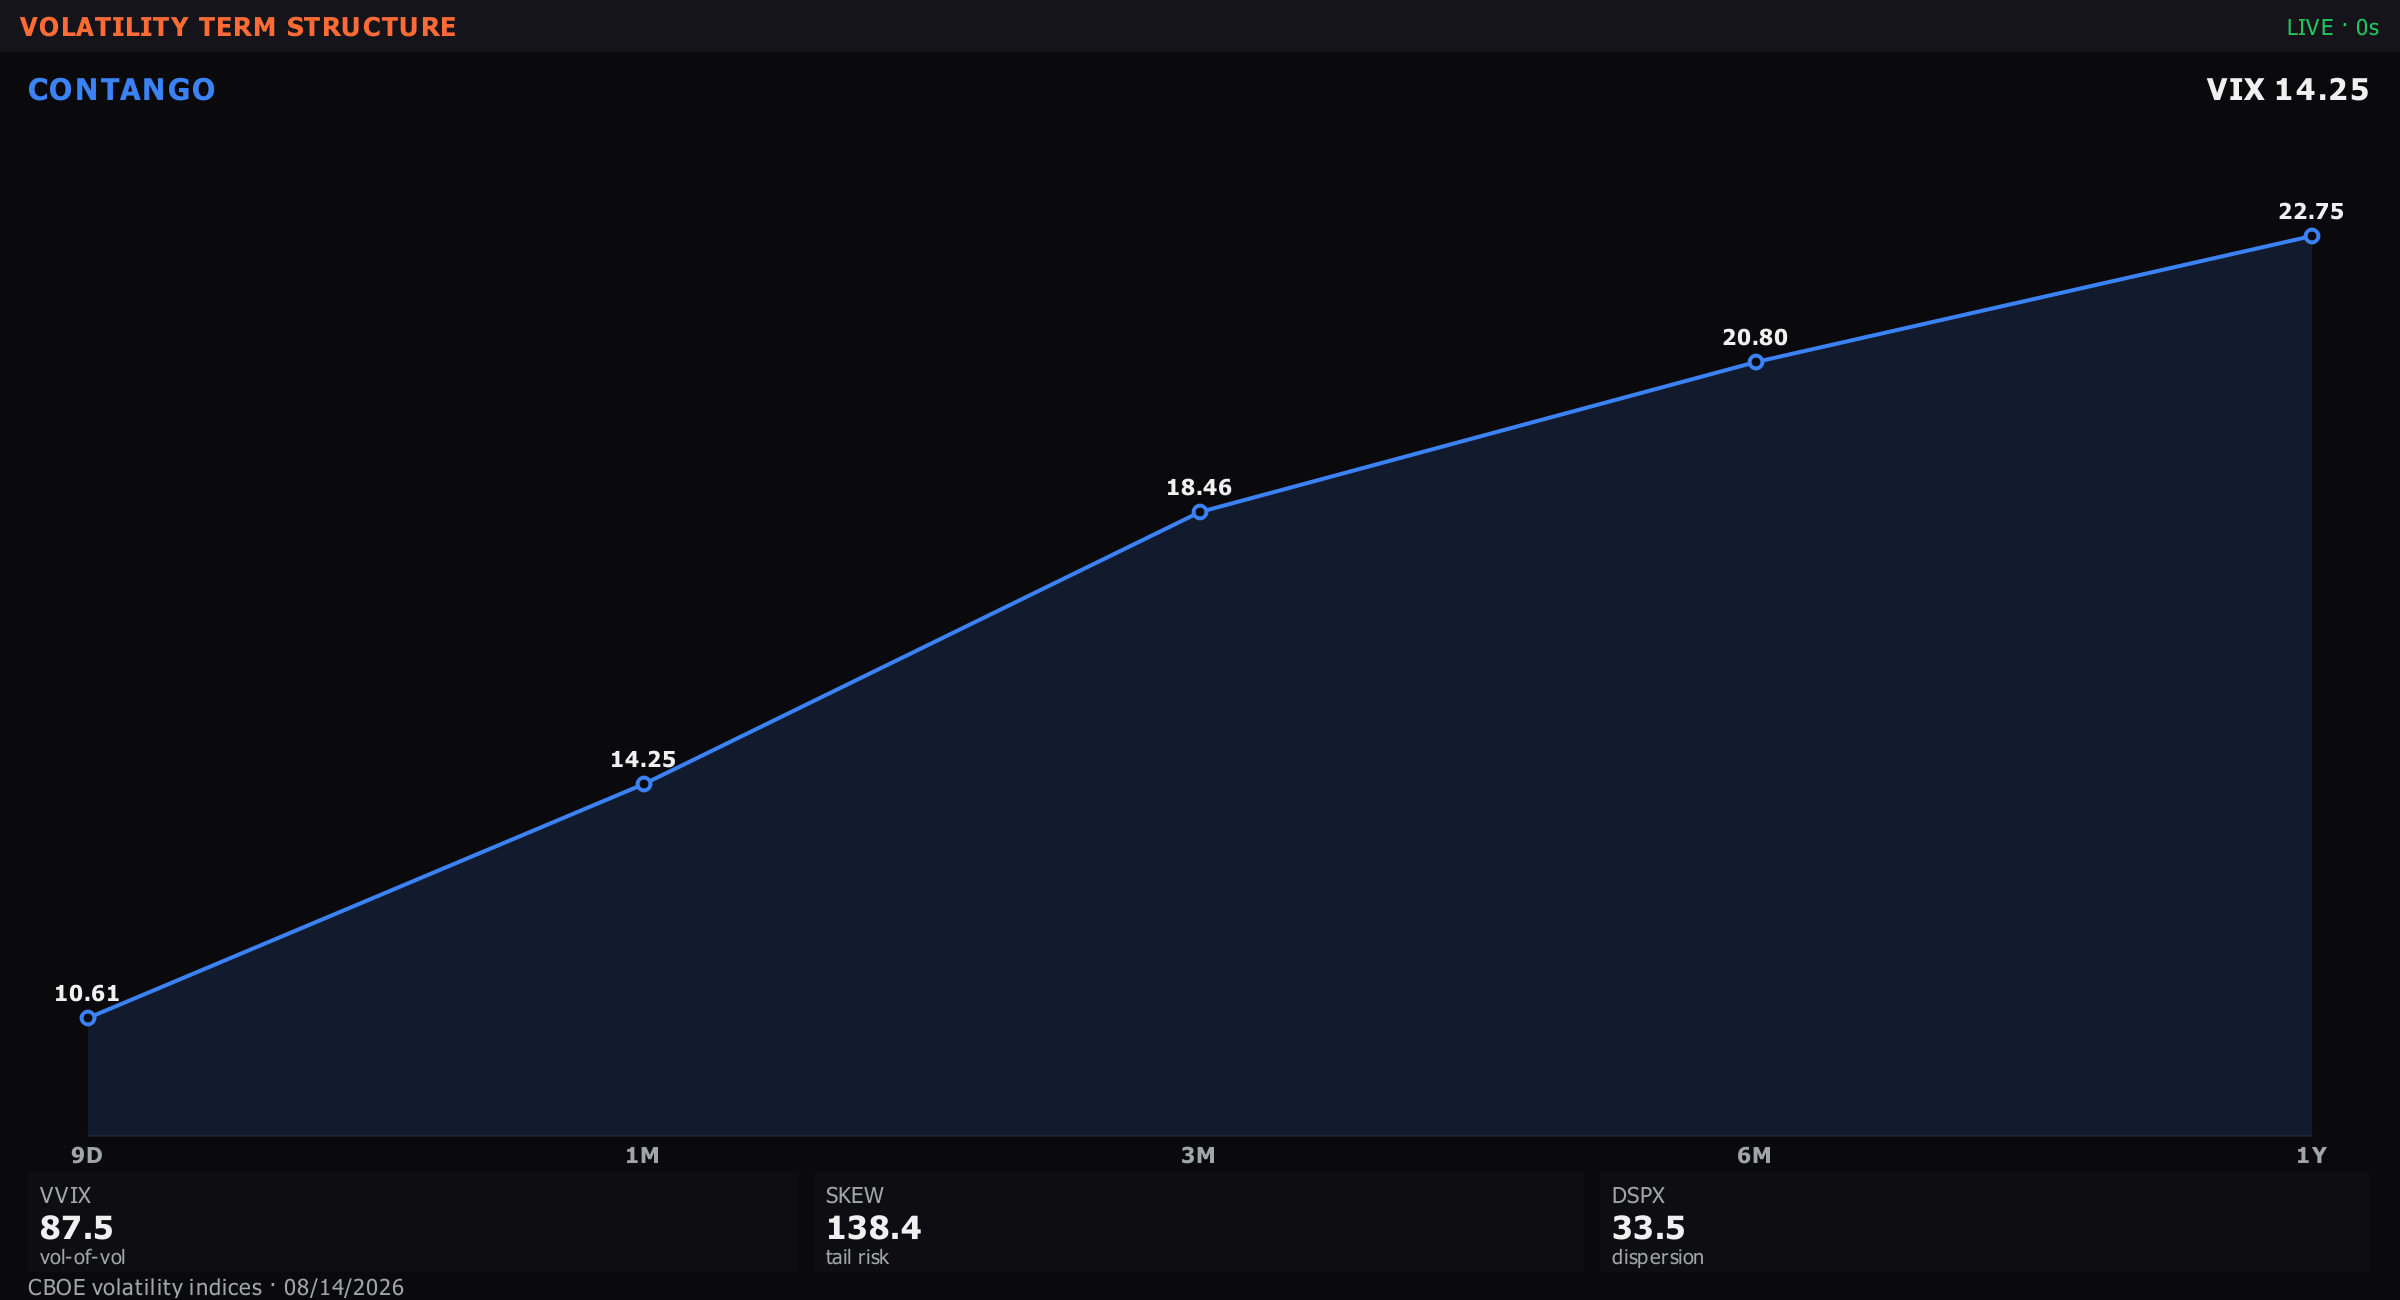
On the large majority of trading days the curve slopes upward. Say spot VIX sits at 15.00, the front-month future trades at 16.50 and the second month at 17.80 — hypothetical numbers throughout. That is contango: each successive month prices volatility higher than the one before it.
The upward slope is not a forecast that volatility will rise. It is closer to an insurance premium. Sellers of forward volatility demand compensation for the risk that a shock lands before settlement, and buyers of portfolio protection pay it. Historically, persistent contango has coincided with calm, trending tape — the regime where realized volatility runs below what the futures imply.
Contango creates the roll-down effect. A future must converge to the index by settlement. If spot stays pinned at 15.00 and the curve holds its shape, that 16.50 front month grinds down toward 15.00 into expiration — 1.50 points of decay, or $1,500 per standard contract, paid by whoever is long. The second month suffers the same slide as it becomes the front: from 17.80 toward the 16.50 slot, roughly 1.30 points, about $1,300 per contract, if the shape simply persists. Nothing about the index moved; the long position bled anyway.
That is the honest ledger for both sides. Long volatility hedges — long VX futures or the long-vol ETPs built on them — lose steadily in contango even when the trader's broader market read is correct. Short-volatility positions harvest that same decay, and they lose abruptly when the curve flips: the premium is collected in ticks and returned in gaps.
Backwardation: the stress signal
Invert the picture. Say spot VIX spikes to 32.00 while the front month trades at 28.50 and the second month at 26.00. Futures below spot, each deferred month cheaper than the last: backwardation.
Backwardation says the market judges current volatility to be unsustainably high. The futures are pricing mean reversion — a drift back toward normal levels by settlement. In past episodes the curve has flipped this way during sharp drawdowns and stayed inverted while the selling was unresolved; late 2008 and the February–March 2020 crash both held deep backwardation for extended stretches. The flip itself is a widely watched regime marker: an inverted front end has historically accompanied tape where large intraday ranges and gap risk dominate.
Roll dynamics reverse too. In the example, a short front-month position at 28.50 faces convergence upward toward a 32.00 index if elevated volatility persists — 3.50 points against the short, $3,500 per contract, before any further spike. Shorting volatility in backwardation is a bet that the stress resolves quickly; when it does not, losses compound through a rising index and a curve that keeps repricing higher. Long-vol positions finally collect roll instead of paying it, but they are buying after the move, at levels that mean reversion punishes if calm returns sooner than expected.
The roll and who pays for it
Because every future expires, any position meant to hold constant maturity must roll: sell the expiring contract, buy the next one. The short-dated volatility ETPs do a version of this daily, shifting weight from front month to second month to maintain an average maturity near 30 days. In contango they perpetually sell the cheaper contract to buy the dearer one — in the earlier numbers, selling exposure near 16.50 to replace it near 17.80, a spread of about 7.9% of the front-month price. Compounded month after month, that spread is the main reason long-vol ETPs have decayed toward zero over long horizons and needed reverse splits to keep quoting.
Inverse products harvest the same spread from the short side, which works until it doesn't: in February 2018 a single-session volatility spike destroyed most of the value of a prominent inverse-VIX product overnight, and it was liquidated. The roll is not free money in either direction. It is a risk premium, and premiums exist because the loss branch is real.
For futures traders the practical implication is narrower: know where your contract sits on the curve and which way convergence pulls it. A calendar spread — long one month, short another — is a direct position on the curve's shape, and it loses when the slope moves against the spread even if the overall level of volatility goes the trader's way.
Why spot VIX stays untradable
The index is a weighted average of continuously changing option prices across an entire strike strip. Replicating it would require holding that whole strip and rebalancing constantly as strikes enter and leave the calculation window — a portfolio whose maintenance costs would swamp the exposure it delivers. No exchange lists a spot-VIX security because none can exist without those costs; every listed instrument settles to the index at a point in time instead. That is the entire reason a term structure exists: since only future readings of the index can be traded, the market must price each settlement date separately, and the curve is the record of those prices.
It is also why "VIX is at 15" tells you less than the curve does. Spot can sit still while the futures reprice the months ahead dramatically — and that repricing, not the spot print, is what moves the instruments in your account.
Reading the curve in practice
A few measures cover most of the signal:
- Front spread — second month minus front month. Positive and wide is comfortable contango; near zero is a curve losing conviction; negative is front-end inversion.
- Basis — front month minus spot. This shrinks into every settlement by construction, so read it against days remaining, never in isolation.
- Percent slope — the front spread divided by the front-month price, which normalizes across volatility levels: 1.30 points on a 16.50 front (about 7.9%) is a different world from 1.30 points on a 30.00 front (about 4.3%).
I check the front spread before every open, next to the gamma exposure profile. A flattening vol curve while dealers sit short gamma is a materially different market from the same spot VIX with a steep curve and long-gamma pinning — the curve supplies the context the spot print leaves out.
Some patterns are routine noise: contango flattening ahead of a scheduled event (CPI, FOMC) and rebuilding afterward signals little. Inversion that persists after the event is the pattern that has historically accompanied extended risk-off phases.
Treat the term structure as regime context rather than a trade trigger. It tells you what the volatility market charges for time and which side of the roll you are standing on — inputs to sizing and instrument selection, not a setup that fires. The traders who get hurt by the VIX complex are almost always trading the spot number they see quoted on television; the ones who last are trading the curve, because the curve is the only thing that was ever tradable.