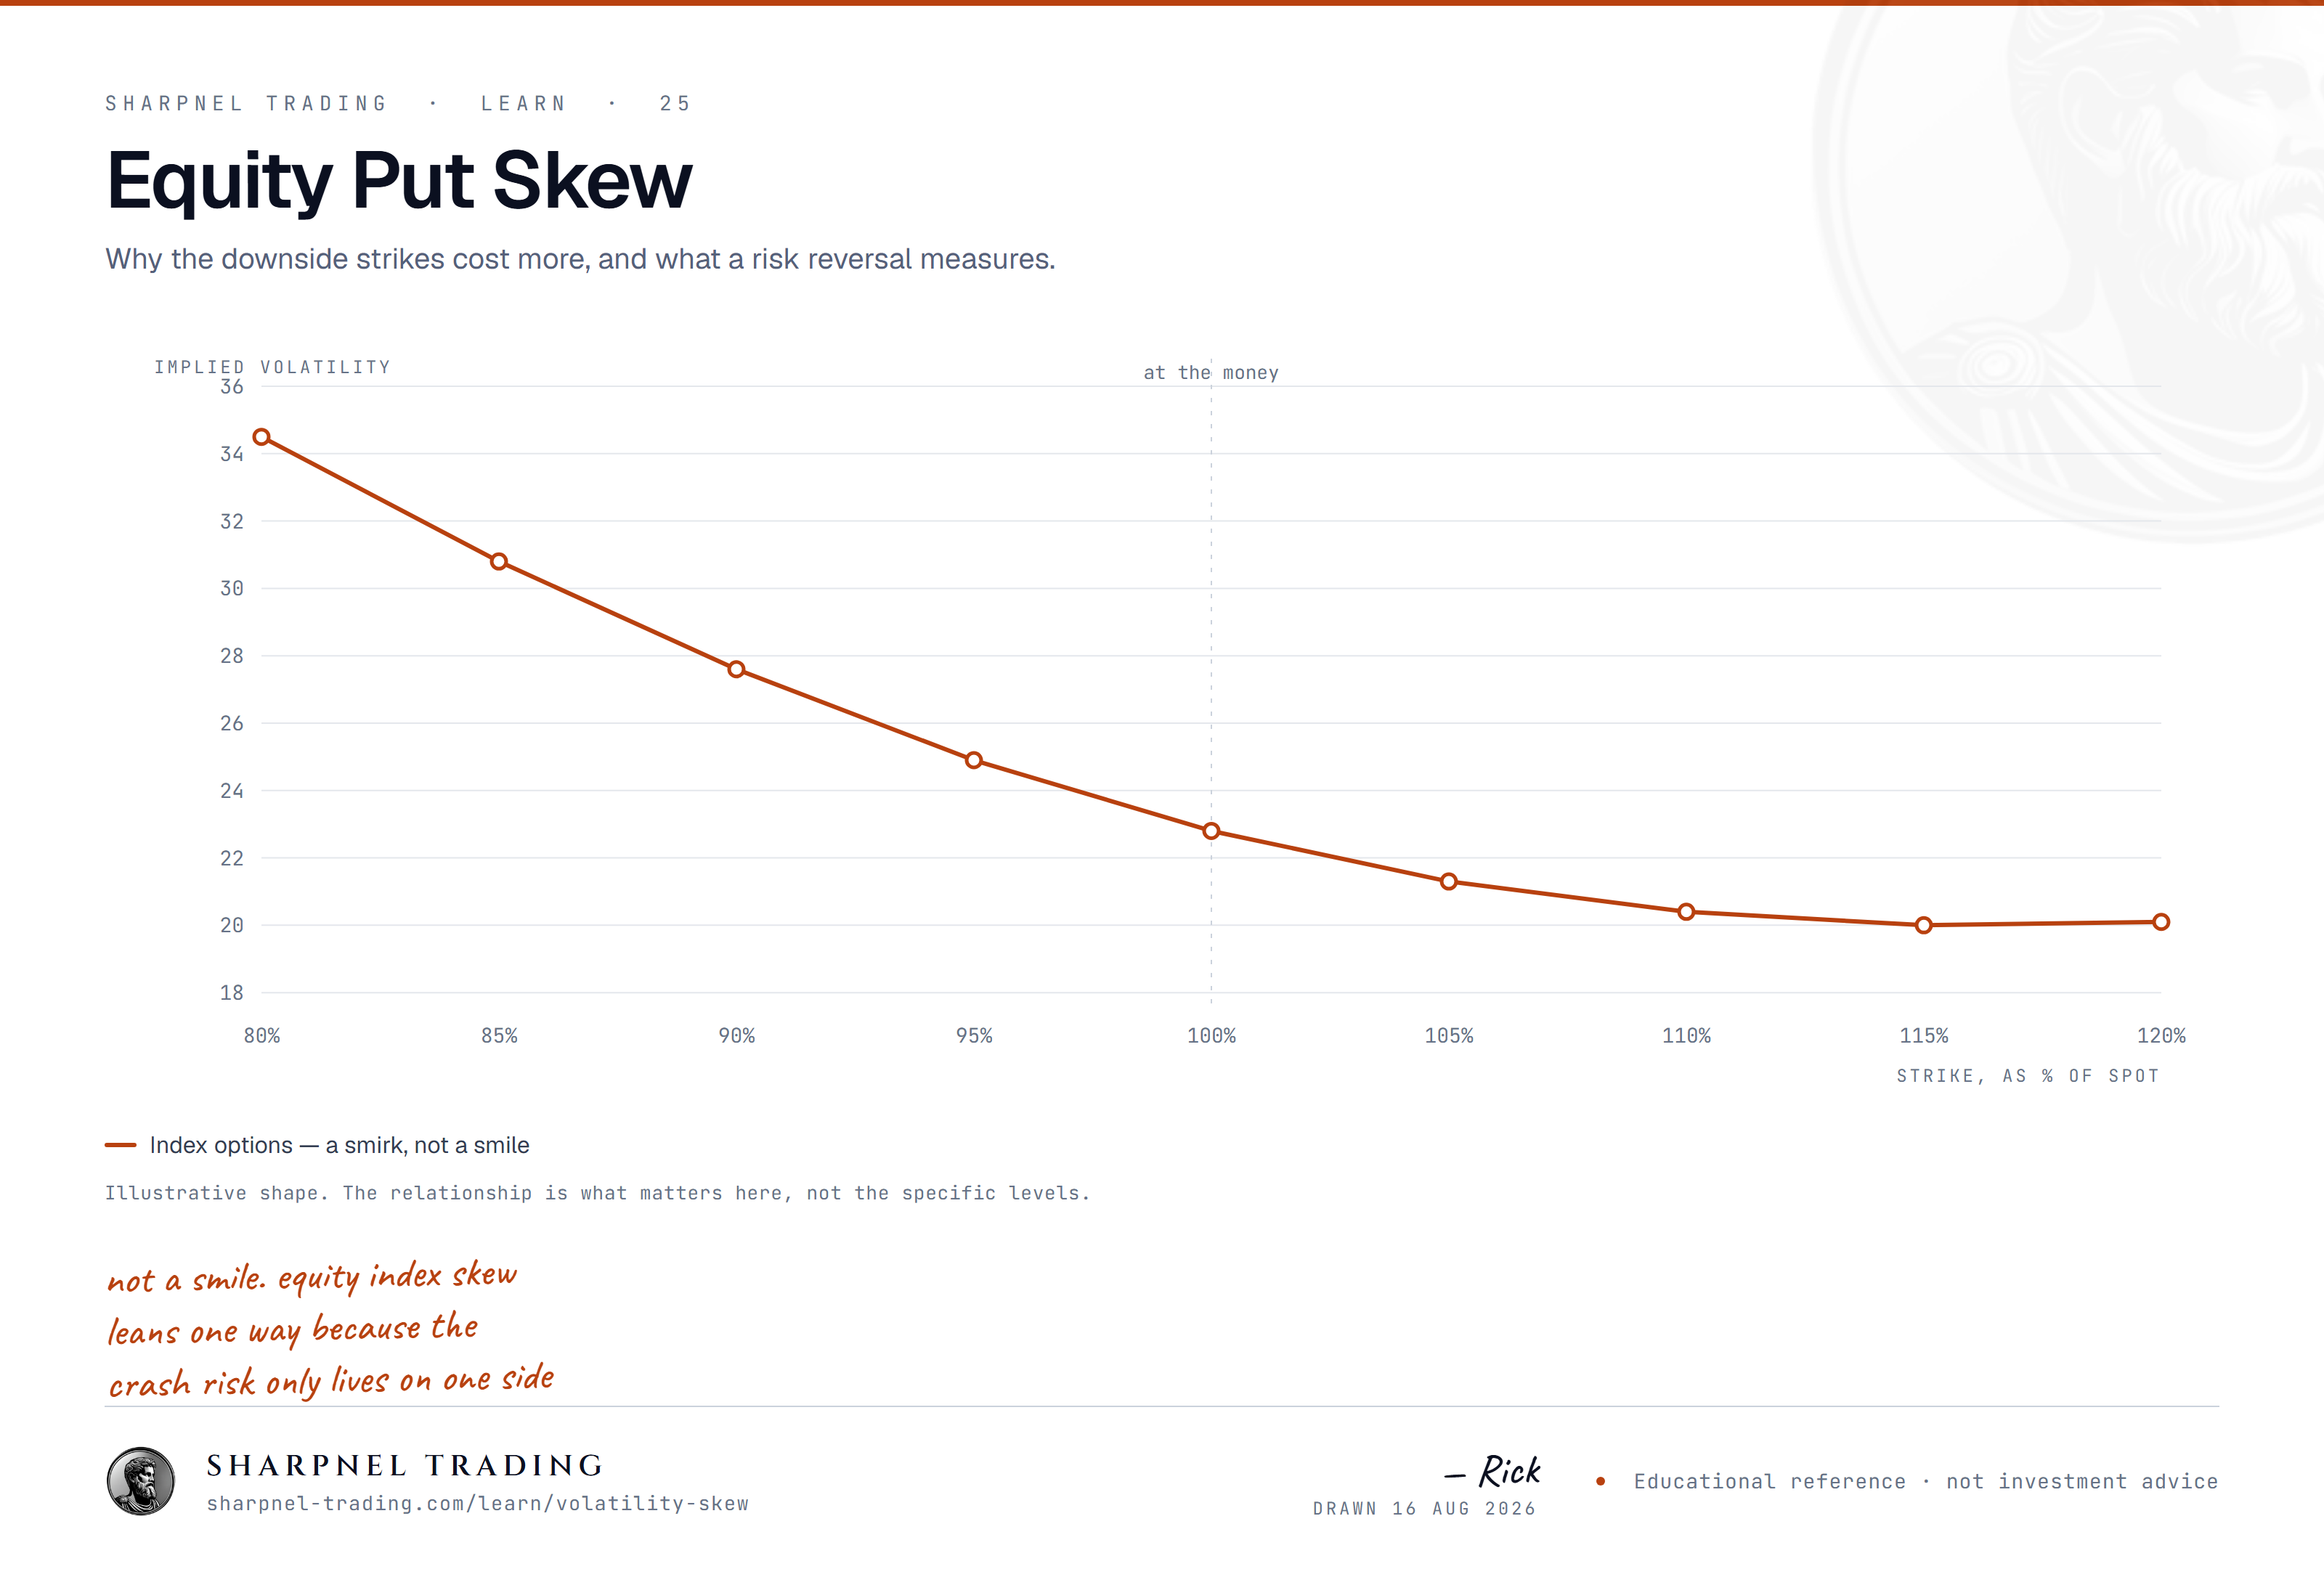
Volatility skew is the pattern of implied volatility varying by strike within a single expiration. In equity index options the pattern is persistent and one-sided: out-of-the-money puts trade at higher implied volatility than out-of-the-money calls the same distance from the underlying. Say ES trades at 5,600 with 30 days to expiration and at-the-money implied volatility of 14%. The 5,320 put — 5% below the market — might carry an 18% implied vol while the 5,880 call, 5% above, shows 12%. Under the textbook pricing model all three strikes would carry identical volatility. The market disagrees, and the shape of that disagreement is information.
The skew exists for two structural reasons. First, crash insurance: institutions are net long equities and pay a standing premium for index puts that protect the portfolio, often selling upside calls to finance the hedge. Second, the leverage effect: falling prices genuinely produce higher volatility, so low strikes correspond to the high-volatility states of the world and deserve richer pricing. The two drivers behave differently under stress, which is why they are worth separating.
Where the Skew Shows Up
Plot implied volatility against strike for a single index expiration and you get a downward-sloping curve — highest at the low strikes, lowest somewhere above the money. Practitioners call the shape a smirk. It appears in every listed equity index product I have ever pulled a chain for: options on S&P and Nasdaq futures as well as the cash index complexes. It has survived decades of traders attempting to arbitrage it away — strong evidence that it is compensation for real risk, not a mispricing.
A useful historical anchor: the skew steepened permanently after October 1987. Before the crash, index option chains traded close to flat across strikes, roughly as the textbook model implies. One session repriced the possibility of a double-digit daily gap, and index options have embedded that memory ever since.
Why Equity Indexes Skew to the Put Side
Crash insurance demand
Pension funds and asset managers — the natural holders of equity risk — buy index puts as portfolio insurance, continuously and in size. Many of the same accounts write covered calls against their holdings to offset the cost. The flow is one-directional and it never really stops: puts get bid, calls get offered. Dealers take the other side and charge a warehousing premium for a risk they cannot fully hedge, because the scenario they are insuring is exactly the one where markets gap through hedge levels and liquidity vanishes. That premium lives in the low strikes as extra implied volatility.
Index skew is also steeper than what most single stocks show, and the reason is correlation. A sell-off is a correlation event: everything falls together, so index volatility spikes harder than the average volatility of its components. Index puts insure the systematic scenario — precisely the risk you cannot diversify away. Individual names can even skew the other way: a rumored takeover target will show call skew, because the jump risk there points up.
The leverage effect
The second driver is mechanical rather than flow-based. When a firm's equity value falls, its debt does not fall with it, so the equity claim becomes more leveraged and its volatility rises. Scale that logic up to the index and you get the empirical regularity underneath the whole curve: returns and volatility are negatively correlated. Down moves happen on rising vol; grinding rallies happen on falling vol. An option struck 5% below the market pays off precisely when volatility is high, so pricing it at the calm at-the-money vol would systematically undercharge. Part of the skew is simply rational pricing of that correlation — it would exist even if nobody bought portfolio insurance at all.
Skew vs Smile
The two terms get used interchangeably, and the sloppiness costs beginners real understanding. A smile is symmetric: both wings trade above the at-the-money vol, producing a U-shape. Genuine smiles show up where a large move in either direction is the risk — currency pairs between comparable economies are the classic case. A skew, or smirk, is asymmetric: one wing dominates. Equity indexes are the canonical put-skewed market.
In practice the curve has two properties worth keeping separate. The slope measures how fast implied vol rises as you move down in strikes — that is the skew proper, driven by the demand and leverage stories above. The curvature measures how much both wings are bid over the middle — that is the smile component, driven by jump risk in either direction. They move independently: after a shock, slope steepens; ahead of a binary event, curvature fattens. Reading the curve means reading both.
How to Read Skew on a Chain
You do not need a volatility-surface model for this; a chain with implied vols on your charting platform will do.
- Compare like with like. Fixed-percentage strikes drift in meaning as volatility changes, so professionals quote skew in delta terms: the 25-delta put against the 25-delta call. Each is roughly the strike with a one-in-four chance of finishing in the money, which normalizes the comparison across expirations and vol regimes.
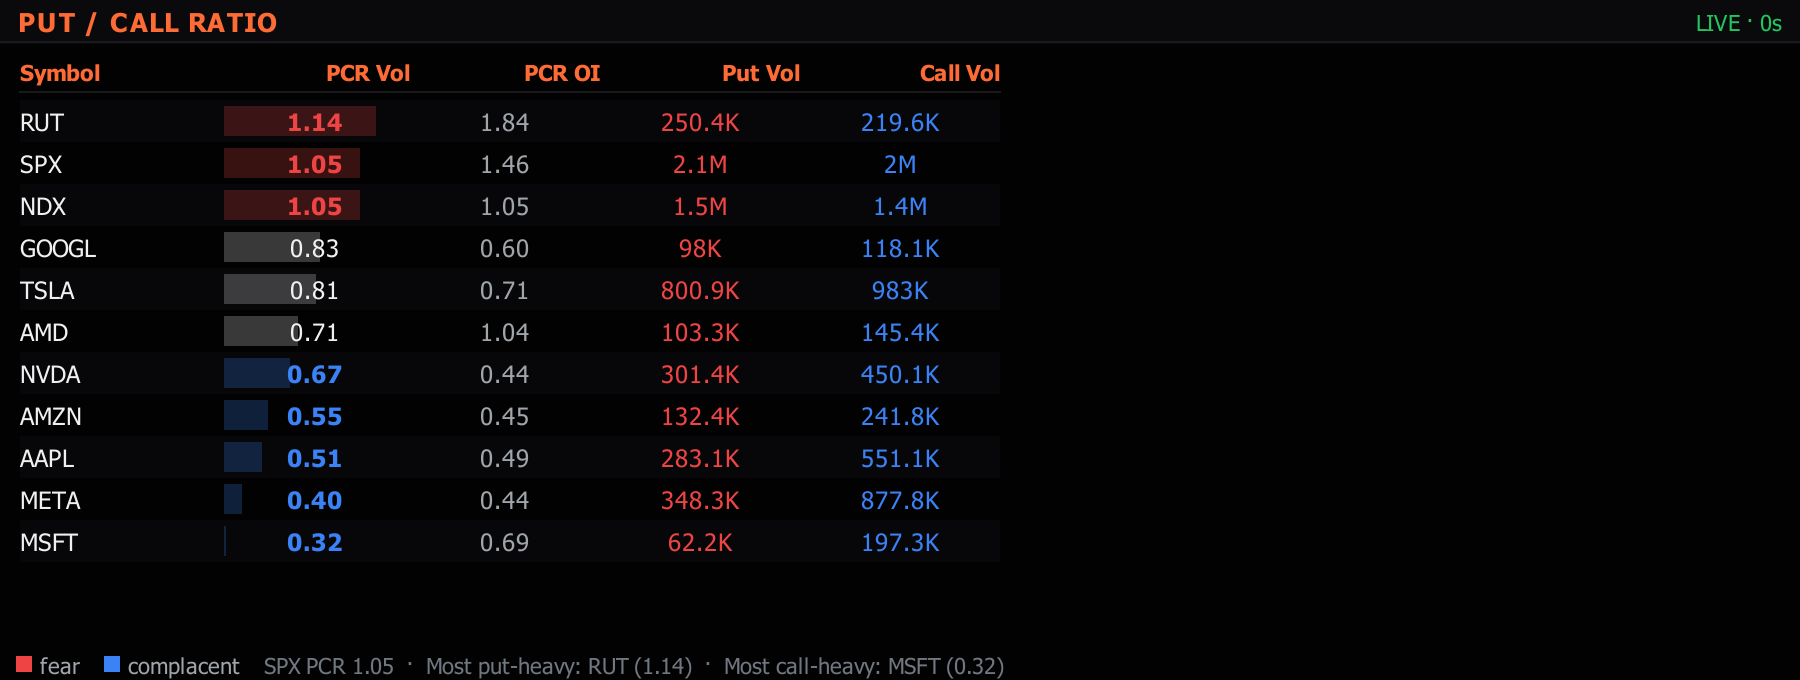
- Steepness is the price of insurance. A steep skew says downside cover is expensive relative to at-the-money — typical after a shock, or when hedging demand concentrates into a narrow window. A flat skew says it is cheap, which reads either as calm or as complacency depending on what else you know.
- Watch changes, not levels. Index skew is always negative, so its existence tells you nothing on a given day. Its day-over-day change does. Steepening while the market rallies is a tell that large accounts are hedging into strength; flattening on a decline can mean puts are being monetized.
- Short-dated skew is its own animal. Near expiration the curve becomes almost pure event pricing, and on expiry-day trading the wings reprice minute to minute — the 0DTE chain is skew read at maximum shutter speed.
- Know sticky-strike from sticky-delta. When spot falls, at-the-money vol usually rises partly because the market has slid down a pre-existing skew curve, not because new information arrived. Separating that mechanical repricing from a genuine vol bid is half the skill of reading a chain in a sell-off.
Risk Reversals: The Skew in One Number
A risk reversal is two things at once — a quote convention and a trade structure.
As a quote, the 25-delta risk reversal is the 25-delta call implied vol minus the 25-delta put implied vol. In equity indexes the number is essentially always negative. Say the ES 25-delta put is marked at 17% and the 25-delta call at 12.5%: the risk reversal is −4.5 vol points. That single number is the market's asking price for crash cover relative to upside participation, and its movement is the cleanest daily skew read available. I check it on ES every session before the open, next to the overnight range.
As a trade, a long risk reversal sells the out-of-the-money put and buys the out-of-the-money call — synthetically bullish, and it harvests the skew because you are short the expensive wing and long the cheap one. Run the honest arithmetic on what goes wrong. Say you sell a hypothetical 5,320 put at 25.00 points and buy a 5,880 call at 20.00, collecting 5.00 points net — $250 on a $50-per-point contract. If the index gaps to 5,150 by expiration, the put finishes 170 points in the money; against your 5.00 credit that is a 165-point net loss, $8,250 per contract, growing point-for-point below that. Before expiration it can feel worse than the terminal math: a volatility spike marks the short put against you while margin requirements expand, exactly when liquidity is thinnest. And on futures options, assignment on that short put leaves you long a futures contract at the strike. The structure fails the same way the insurance sellers it mimics fail.
The short risk reversal — long put, short call — is the mirror image, and it bleeds instead of gapping. You pay the rich wing's premium away as it decays, while a grinding rally walks the short call into the money. Neither direction is an edge by itself; the negative risk reversal is compensation for a risk that periodically shows up and collects.
Where Skew Meets Dealer Positioning
The put flow that creates the skew does not vanish once it trades — it sits on dealer books as inventory that must be hedged. Concentrated put open interest below the market becomes a visible put wall, and the aggregate hedging pressure from that inventory is measurable as gamma exposure. The two reads answer different questions. Skew tells you what the market is paying for downside cover; dealer positioning tells you where the hedging of that cover will push price once it moves. A steep skew over a market where dealers are short downside options is a combustible pairing, because their hedging sells into weakness.
Skew is a priced distribution, not a forecast. A steep curve has preceded crashes, and it has preceded nothing at all; the 1987-shaped memory in the low strikes is permanent, so its mere presence proves little. What the curve reliably tells you is what the downside costs today versus yesterday, and which wing of the distribution the largest participants are paying up for right now. Read it as a map of positioning and priced fear — then let price action decide what to do about it.