Penny Scanner momentum wall center, Chart + T&S left, Watchlist + DOM right — click a runner to chart it
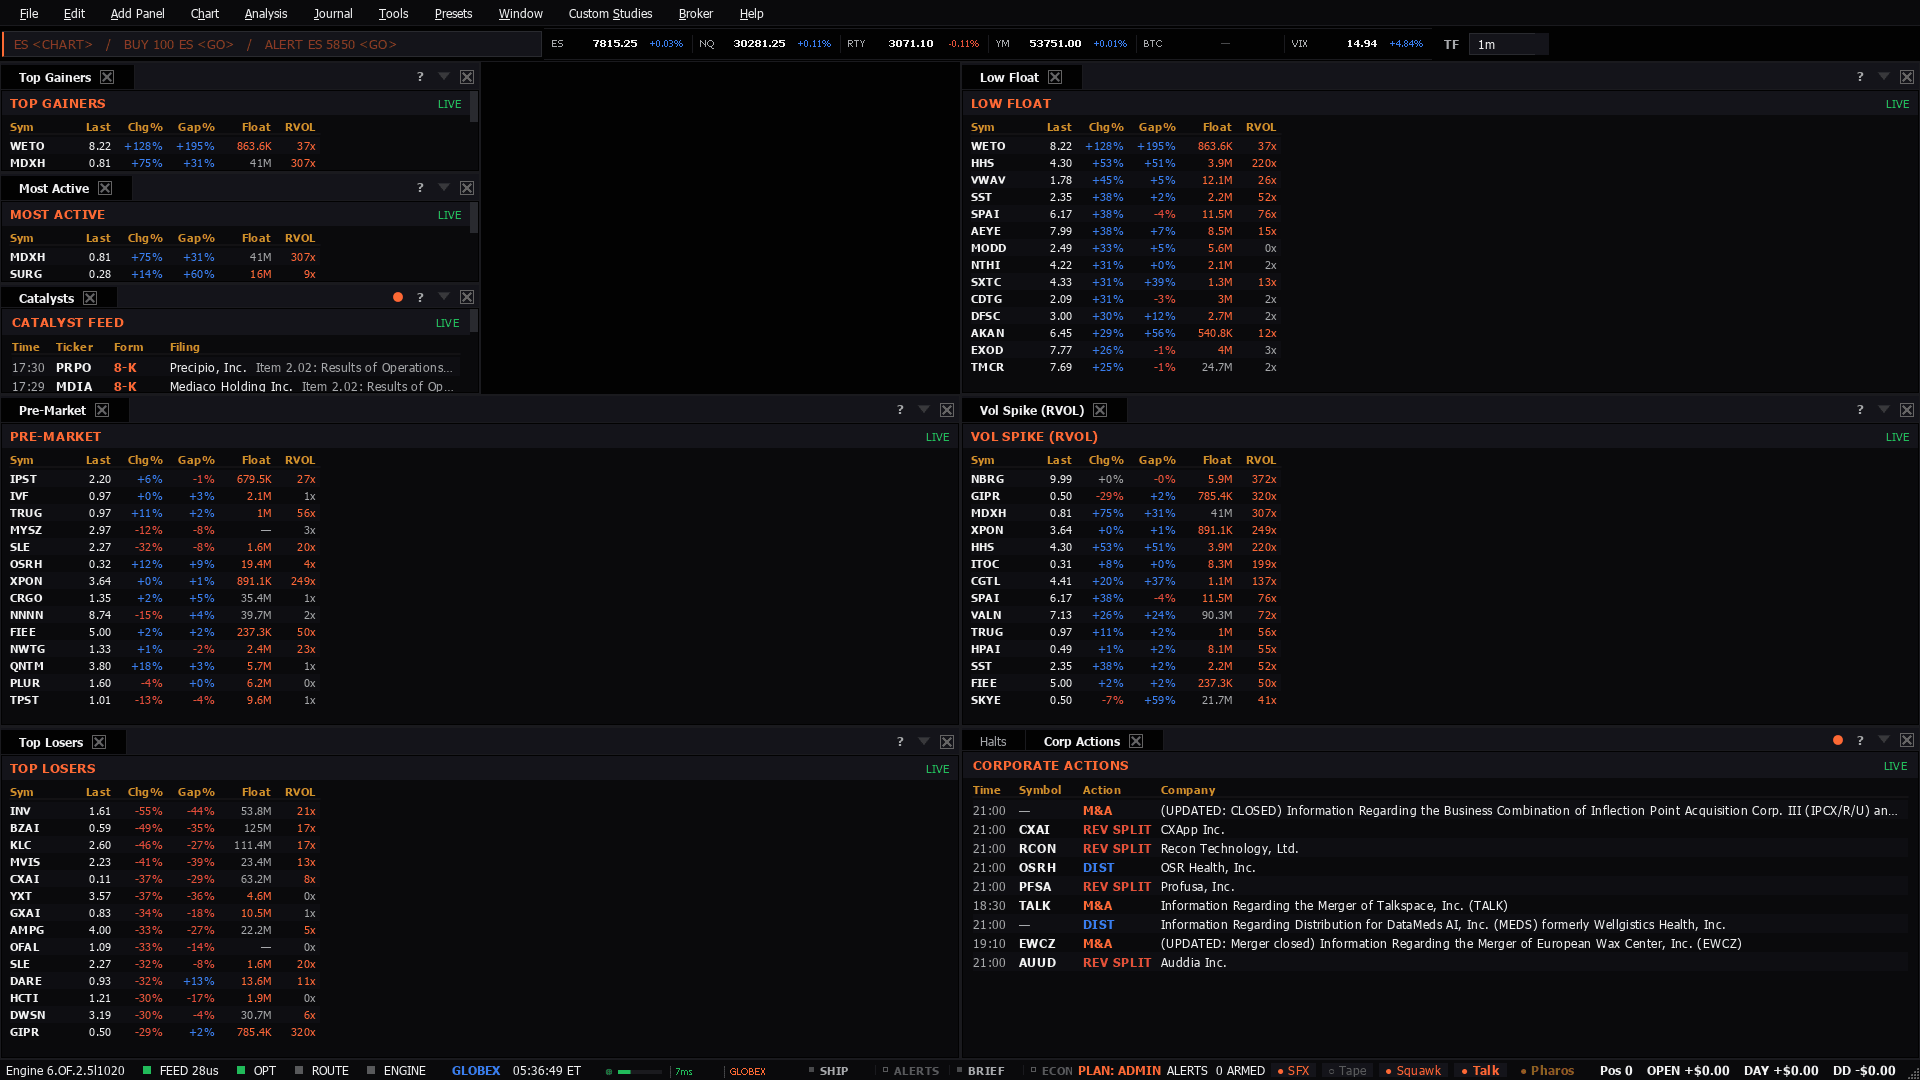
Penny Scanner momentum wall center, Chart + T&S left, Watchlist + DOM right — click a runner to chart it
Use it when: Low-float momentum, where the risk is liquidity rather than direction.
Presets in the menu bar, under the category this desk belongs to — one click applies the whole layout, and a checkmark tracks which one is active.Ctrl+P, which finds it by name.Add Panel menu.The tell: Check the halt and corporate-action feeds before the chart. In this corner of the market the tape stopping is the most common outcome.
3 panels, read straight from the preset definition in the desktop build:
These desks assume the theory. If any of it is unfamiliar, the background reading is on the learn side:
