The rates & curve sheet leads the center with the Chart tabbed beside it over the Economic Calendar; Central Bank speeches + Regulatory Wire left, Bank Stress + Yield Curve right — the macro-event & policy cockpit
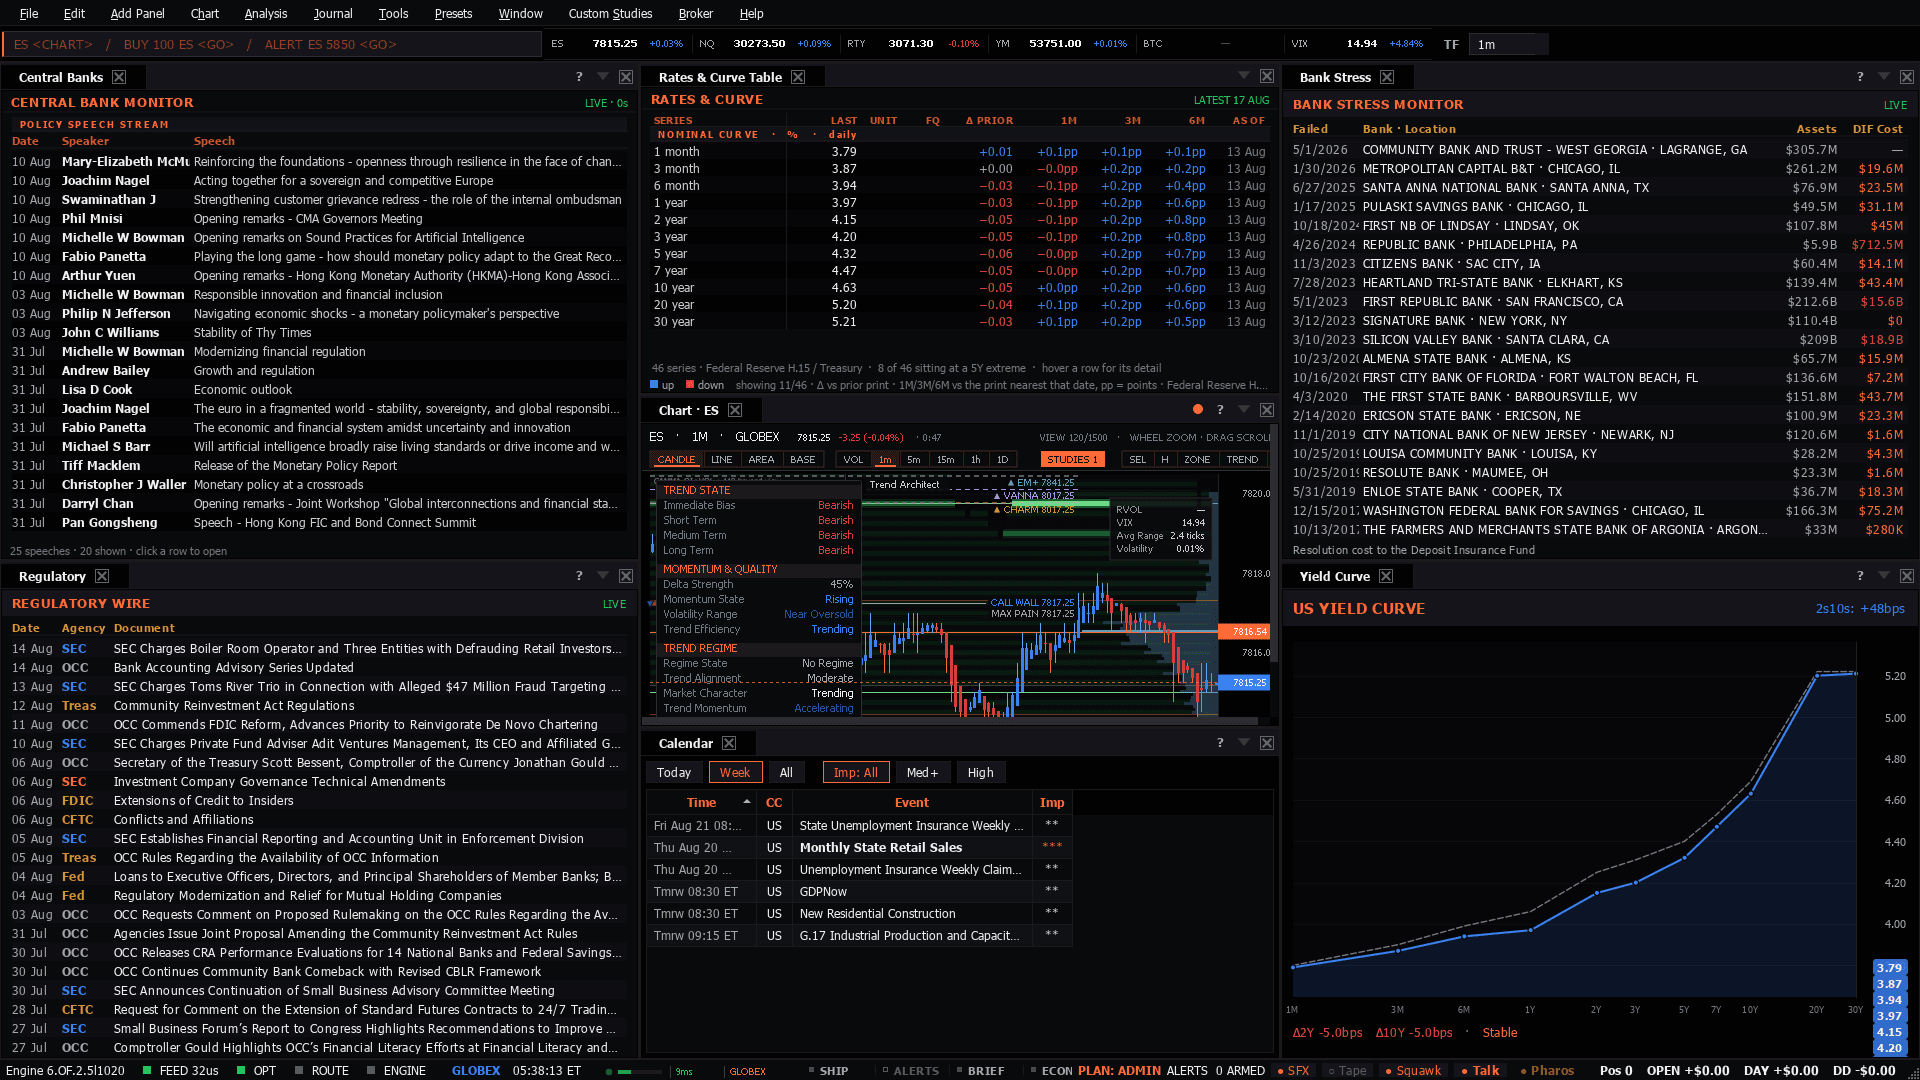
The rates & curve sheet leads the center with the Chart tabbed beside it over the Economic Calendar; Central Bank speeches + Regulatory Wire left, Bank Stress + Yield Curve right — the macro-event & policy cockpit
Use it when: Around a central bank meeting or a regulatory event.
FOMC days: the statement at 14:00 ET and the press conference at 14:30. Both index futures trade the gap between what is said and what was already priced.
The move is rarely the decision itself. It is the dot plot and the tone against what the curve had already discounted - which is why you read the rates sheet before the statement, not after.
Larger reaction, for the same reason it always is: the rate path is worth more to long-duration cash flows.
Reacts through the dollar and the growth read. Real, but second-order.
Presets in the menu bar, under the category this desk belongs to — one click applies the whole layout, and a checkmark tracks which one is active.Ctrl+P, which finds it by name.show me central bank.Add Panel menu.The tell: The gap between what is being said and what the curve has priced is the trade. Neither side alone is.
6 panels, read straight from the preset definition in the desktop build:
Plus 1 dense sheet — wide tables that carry a whole complex in one upstream call rather than a wall of single-series tiles:
These desks assume the theory. If any of it is unfamiliar, the background reading is on the learn side:
