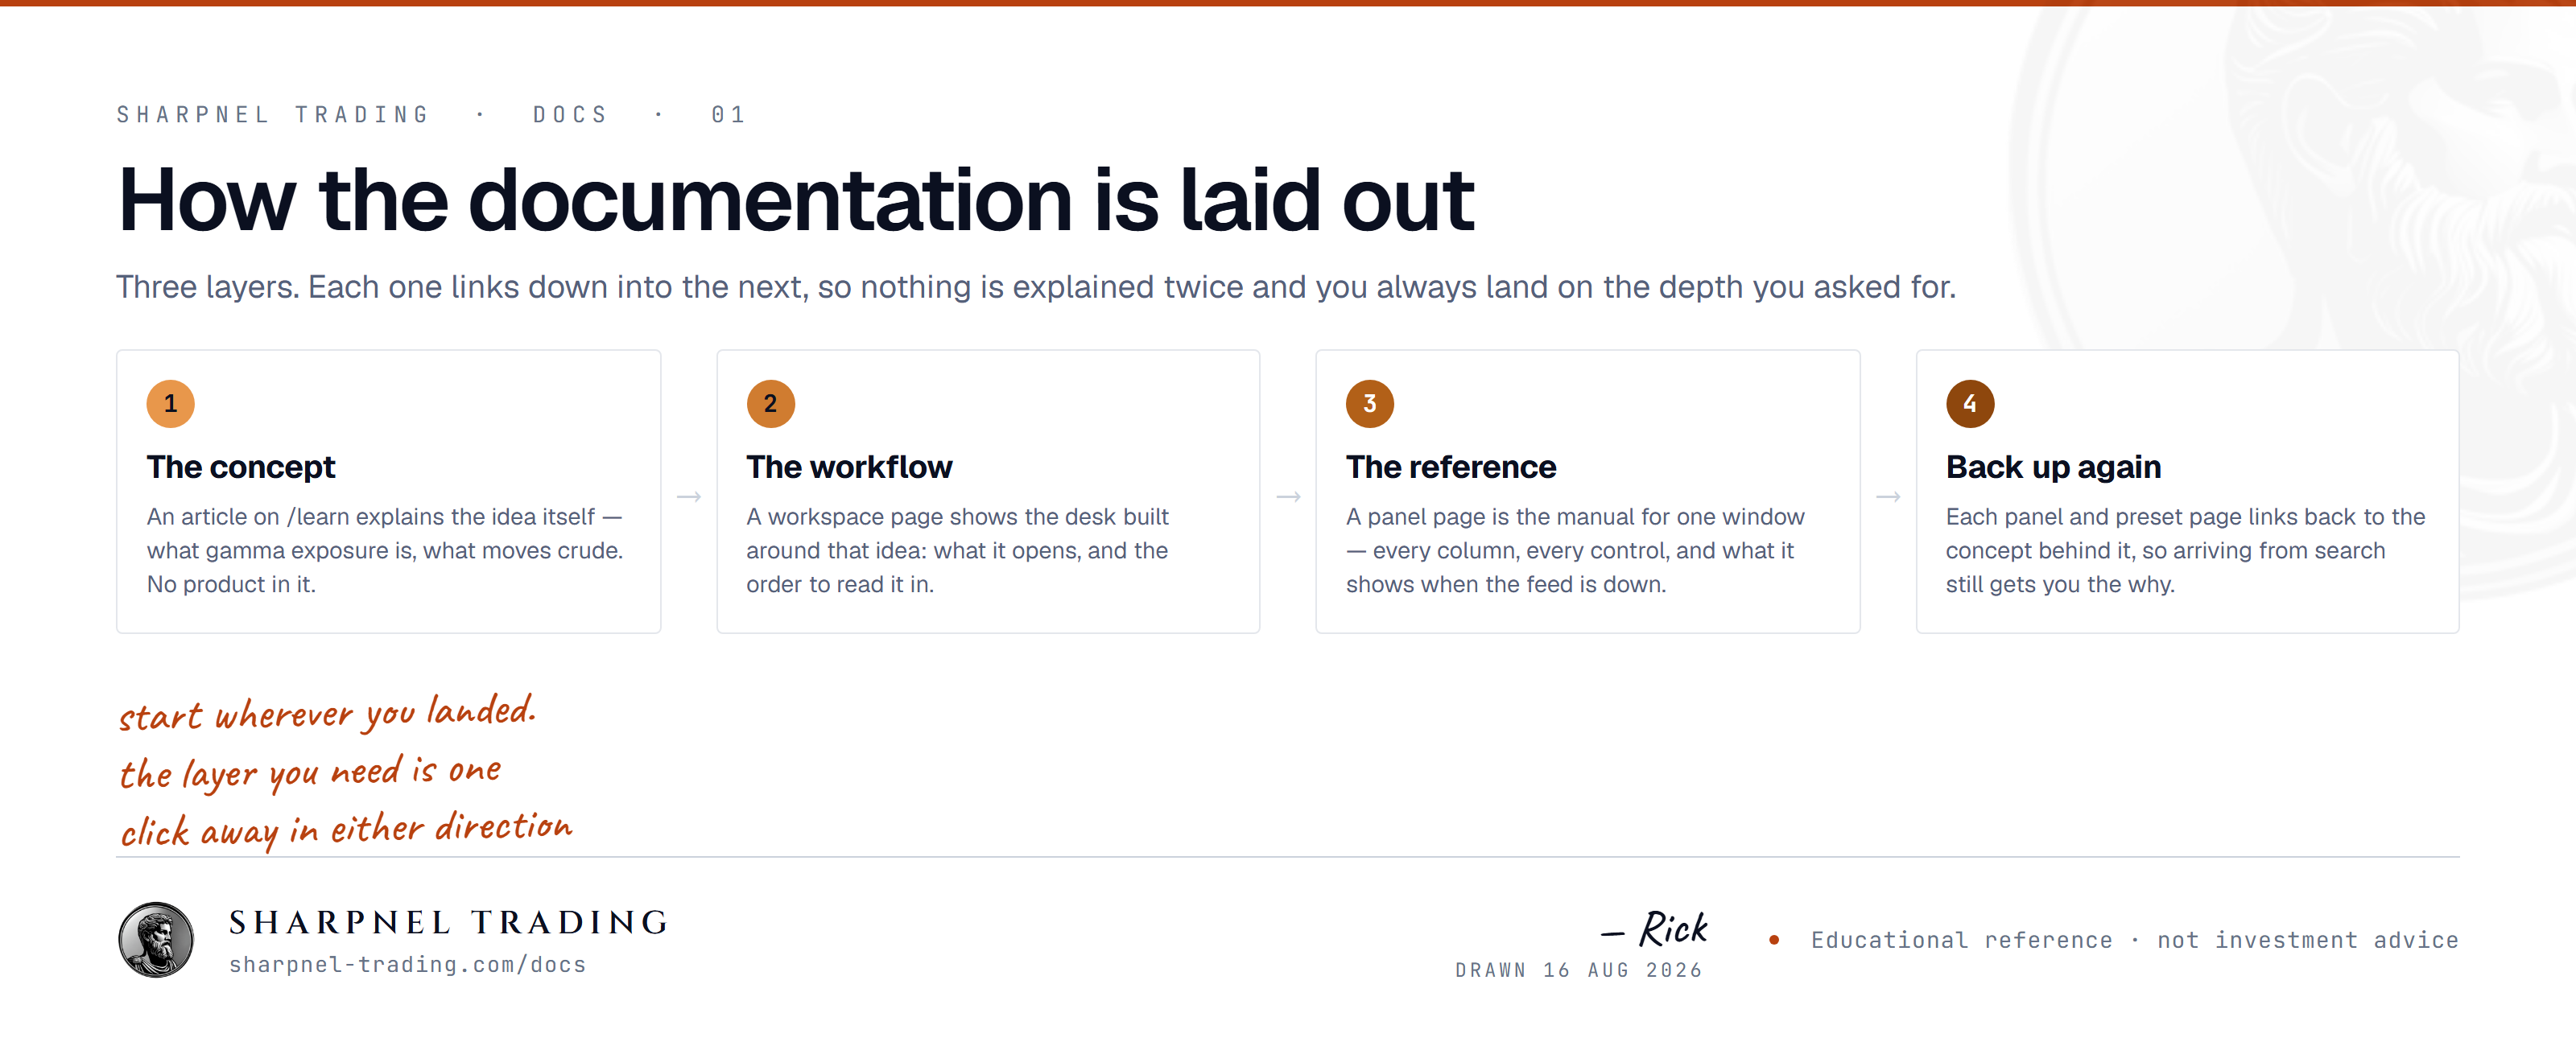
Everything the Sharpnel desktop terminal ships with — the desktop guides (getting started, workspaces, broker, the DOM ladder, the trade journal), panels, palette grammar, custom studies, world-map layers, keyboard shortcuts. Pick a section below or search by name, mnemonic, or feature.
The native Sharpnel terminal — Windows today, macOS and Linux in active development — multi-monitor, your own broker feed, and native C++ studies. Included with Pro.
First run on Windows — sign in, the default workspace, opening panels, and your first desk preset.
Docking, tabs, floating panels, multi-monitor, multi-DOM, link groups, and the built-in desk presets.
Bring-your-own-data broker connection, depth entitlements, and the trading safety model (paper by default, explicit ARM).
Hosting the terminal on a Windows VPS for all-session uptime — what I run my own infrastructure on, what to pick, and how to set it up.
The price-centered depth ladder — reading it, trading from it, and setting alerts on it.
The built-in journaling system — what it records, tagging, and reviewing your sessions.
How the desktop terminal updates itself — signed builds, checking your version, and what happens on a failed update.
Order book with Pull/Stack, MTF Value Area, Reconstructed Tape, DOM Volume Bars, and persistent VWAP / POC / gamma overlays. The headline order-flow surface.
Bid/ask volume inside every candle. Imbalance coloring.
Time-Price-Opportunity letters. Composite and split modes.
The print tape.
Re-watch a stretch of your session — the tape, the chart and your own actions on top.
GEX dealer-gamma levels — call wall, put wall, gamma flip and more — drawn on the same chart as the DOM and footprint. Read where dealers defend.
Full chain, Greeks, IV surface, unusual activity.
Preset payoff diagrams — vertical / condor / butterfly / straddle.
Per-expiry max-pain + concentration + composite pin score.
Options sentiment gauge across SPX / NDX / VIX + major names.
Contango / backwardation curve for VIX / ES / CL / GC / ZN.
3D implied-volatility surface — strike × DTE × IV. Reads put skew, call skew, contango / backwardation at a glance.
Candles, indicators, drawings. The primary surface.
Multi-symbol side-by-side fundamentals + peer-relative metrics.
N×N symbol correlation grid + diversification register.
Two-leg rebased relative-value with z-scored ratio + ±σ bands.
OLS regression vs SPY — beta, alpha, R² across 60/120/252-day windows.
Symbol-scoped β / α / R² vs benchmark.
US Treasury 1M-30Y curve + key spreads + regime classifier.
NY Fed reference rates (SOFR/EFFR/OBFR/BGCR/TGCR) + key stress spreads.
HY / IG / AAA / BBB OAS + CDX indices + EMBI + regime classifier.
Last 90 days of US Treasury auction results.
CPI / Core CPI / PCE / Core PCE / PPI YoY vs the 2% Fed target.
Releases + central-bank meetings + consensus + actuals.
EWMA of actual-vs-consensus economic releases.
8×8 G8 cross-rate grid with hot-cell coloring.
11 SPDR sector ETFs vs SPY across multiple horizons + RS + regime classifier.
Daily creations + redemptions across major ETFs by category.
Live leadership meter for the seven megacaps that move the Nasdaq — each name's buy/sell pressure side by side — plus a blended-basket footprint. Read who's actually leading the index, in the heat of the moment.
Recent + upcoming IPOs with pricing range, final price, first-day pop, status, and above-range demand barometer.
Splits / dividends / spinoffs / M&A / rights / buybacks.
Kalshi + Polymarket contracts on macro, elections, geopolitics.
Valuation, margins, growth, balance-sheet snapshot for any equity.
Street consensus + price targets + rating-change history.
13F filings with QoQ position actions + concentration register.
SEC Form 4 filings with cluster-signal detection.
DTC + % float short + borrow rate + squeeze-setup scoring.
Next print countdown + 8-quarter surprise history.
One-pager security description — vitals, valuation, consensus, headlines, drill-down mnemonics.
Cash + buying power + margin + day-trade counter.
Open positions with realised + unrealised P&L per leg.
Working orders — what's currently resting in the market.
Staged order ticket — bracket / OCO / TWAP / VWAP.
Reviewable trade entries with notes, screenshots, performance.
Price, volume, and script-driven alerts with sound + push.
Draw the dealer-gamma levels and the gamma-by-strike profile inside the charting platform you already trade on. Install, API keys, and what each line means.
Write studies in native C++, compile them in the built-in editor, and load them in the desktop terminal. The compiler ships bundled — no toolchain to install.
Open the Study Editor, compile the built-in starter study, and watch it land on a live chart — step by step.
The frozen C-ABI: the six exports a study implements, the bar/series/input/sink types, the drawing API, and the safety contract.
What Compile & Load actually runs — the bundled clang++ invocation, the exact flags, where the .dll lands, and how to read compiler output.
Two complete studies walked through line by line — a moving-average overlay and a momentum sub-pane histogram — straight from the shipped examples.
Real failure modes and their fixes — the compiler-not-found banner, include-path errors, empty plots, fault-disable, and ABI mismatches.
Can't find what you need?
Request a doc page — I write them the same week they're asked for.
