gex dom footprint
The point of putting dealer levels next to the order flow is the moment price arrives at the wall: what the ladder does there, what the footprint prints there, whether bids are being pulled or stacked. In Sharpnel the call wall, the put wall and the gamma flip are recomputed about every 60 seconds and drawn through the DOM ladder, the footprint and the chart at their live prices, in one program on one symbol bus, so all three show the same instrument at the same moment.
The problem
A positioning service and an order-flow platform are two products from two vendors with two data paths. The wall in one and the ladder in the other are never quite in the same moment, and the discrepancy is plumbing.
You read a strike in a dashboard, switch to the DOM and eyeball where it lands. When price gets there you are looking at one window and the reaction is in the other.
The level, the ladder, the footprint and the tape each want your eyes at the same second. If they live in separate applications you will miss one of them, and it will be the one that mattered.
What Sharpnel does
DOM V2 draws the call wall, the put wall and the gamma flip at their live prices through the ladder, recomputed about every 60 seconds from the live option chain. The ladder's Pull/Stack column shows what is being pulled out of the book and stacked in as price approaches, so the level and the liquidity at the level are one picture.
Footprint V2 splits every candle into bid and ask volume per price with imbalance colouring, a delta profile and absorption detection, in five modes. The DOM carries its own footprint band at 1, 3 or 5 minute bars. The same walls run through both.
The chart, the DOM, the footprint, the TPO panel and the options workspace follow the same instrument. Change the symbol once and every panel changes with it; the multi-dom preset opens four ladders side by side, and the futures desk preset opens the chart, the ladder and the walls together.
Pharos says when price reaches the call wall you were watching, whether it is the third push into it, and whether bids outweigh offers on the ladder at the level. She states what the data shows, never what to do, and says nothing when nothing is happening.
| The job | Two tools | Sharpnel |
|---|---|---|
| Where the wall is | A dashboard | Through the ladder, the footprint and the chart, at its live price |
| When price gets there | Alt-tab, eyeball | The ladder, the footprint and the voice, at the same moment |
| The symbol | Set twice, drift twice | One symbol bus |
| The clock | Two feeds, two clocks | One program |
You pay your own broker or exchange market-data fees where your platform requires them.
ES and NQ as captured at 08:30 ET, every trading day, and after the close whether they held. Free, one mail a day, unsubscribe anytime.
Pharos · September 9, 2026 · NQ · 09:58 ET
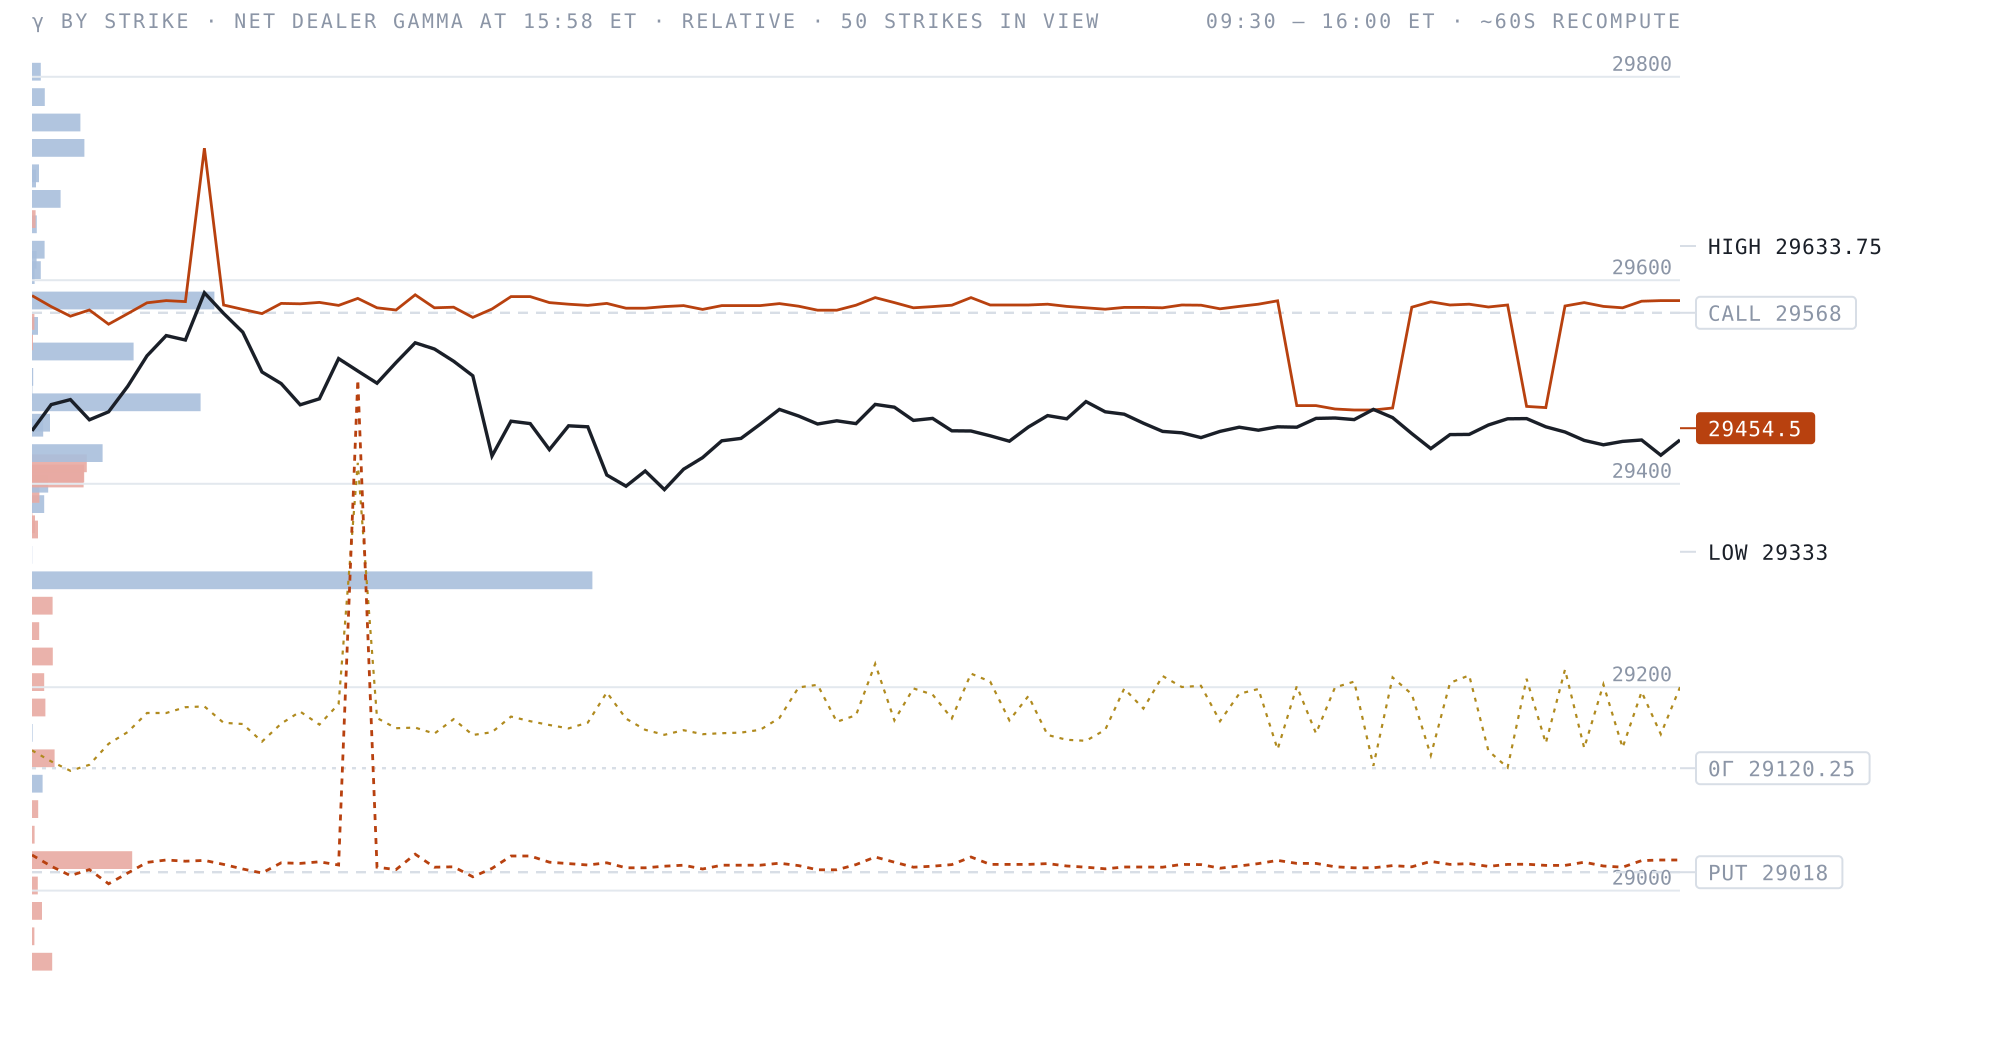
“Wednesday's receipt. The call wall on NQ was 29568. Price reached it at 9:58 a.m. Eastern, returned at 10:44 a.m. Eastern, and this time it gave way. The session high was 29633.75.”
The close read, from the gamma engine
This is a real end-of-session read from my own OI-derived gamma engine — where the walls sat when the bell went, published once a day and never retouched. What it can't show you is the session itself: in the terminal these levels rebuild about every minute on your own chart, next to the DOM, the footprint and the tape, with the zero-gamma line and the full strike profile. The walls move all day. This page shows you where they ended up; Pro shows you while it's happening.
OI-derived dealer-gamma estimate · published once after the close here, rebuilt ~60s in the terminal · informational, not advice
$125/mo — or $94/mo billed annually
What you are reading here is free and stays free. Pro is the live one: these walls and the full strike profile rebuilt about every minute while the session runs, on the same chart as the DOM, the footprint and the tape — and drawn inside your own charting software too.
