gex on chart
Yes, this exists, and it exists two ways. Sharpnel draws nine dealer-gamma level types on the price chart of its own terminal, recomputed about every 60 seconds from the live option chain, next to the DOM ladder and the footprint. And if you would rather keep the charts you already run, a study for six charting platforms draws the same walls there, with one key from your account. Today's ES and NQ walls are free to read every morning and graded at 4:15 pm ET.
The problem
Most gamma tools hand you a table. You read the strike, switch to the chart you trade, and eyeball where it lands. By the time price gets there you are checking the table again to see whether the wall moved, and it usually has.
Drawing this morning's walls as horizontal lines works until 0DTE flow rebuilds the surface. The line stays where you drew it; the wall does not. An indicator that is fed a static number is a picture of the pre-market.
A trader with years of layouts, hotkeys and studies in one platform is not moving to another to get one overlay. The level has to come to the chart, not the other way round.
What Sharpnel does
Call wall, put wall, gamma flip, max pain, expected move, high-gamma zones, vanna, charm and the 0DTE share, drawn on the price chart at their live prices on ES, NQ, SPX and the other names the chain covers. The same lines run through the DOM ladder, the footprint and the TPO panel, because they are one program on one symbol.
Each cycle re-pulls the option chain, recomputes Black-Scholes gamma per contract on current implied volatility, re-aggregates by strike and rescales to the live futures price. The line on your chart at 11am is the wall that is there at 11am, not the one from the open.
Studies for Sierra Chart, NinjaTrader 8, Quantower, ATAS, MotiveWave and Bookmap draw the call wall, the put wall, the gamma flip and the per-strike gamma profile on your own chart, with prior-state ghost dots at 1, 5, 10, 15 and 30 minutes so you can see a wall migrating. One API key from your account, no second subscription; the studies are part of Pro.
Pharos, the terminal's voice, tells you when price reaches the call wall you were watching, whether it is the third push into it, and whether bids outweigh offers on the ladder at the level. She says what the data shows and never what to do about it.
| The job | A gamma dashboard | Sharpnel |
|---|---|---|
| Where the level lives | A table in a browser tab | On the chart, at its live price, in the terminal or in your own platform |
| Keeping it current | Read the table again | Recomputed about every 60 seconds, ghost dots show the migration |
| Your charting platform | Unchanged, and unaware of the level | Unchanged, with the walls drawn on it by a study |
| When price gets there | You notice, or you don't | The terminal says so and shows the ladder at the same moment |
| The record | Rarely published | Every session since July, graded in public |
Today's free walls are a morning snapshot by design; the intraday recompute is the paid product. You pay your own broker or exchange market-data fees where your platform requires them.
ES and NQ as captured at 08:30 ET, every trading day, and after the close whether they held. Free, one mail a day, unsubscribe anytime.
Pharos · September 9, 2026 · NQ · 09:58 ET
“Wednesday's receipt. The call wall on NQ was 29568. Price reached it at 9:58 a.m. Eastern, returned at 10:44 a.m. Eastern, and this time it gave way. The session high was 29633.75.”
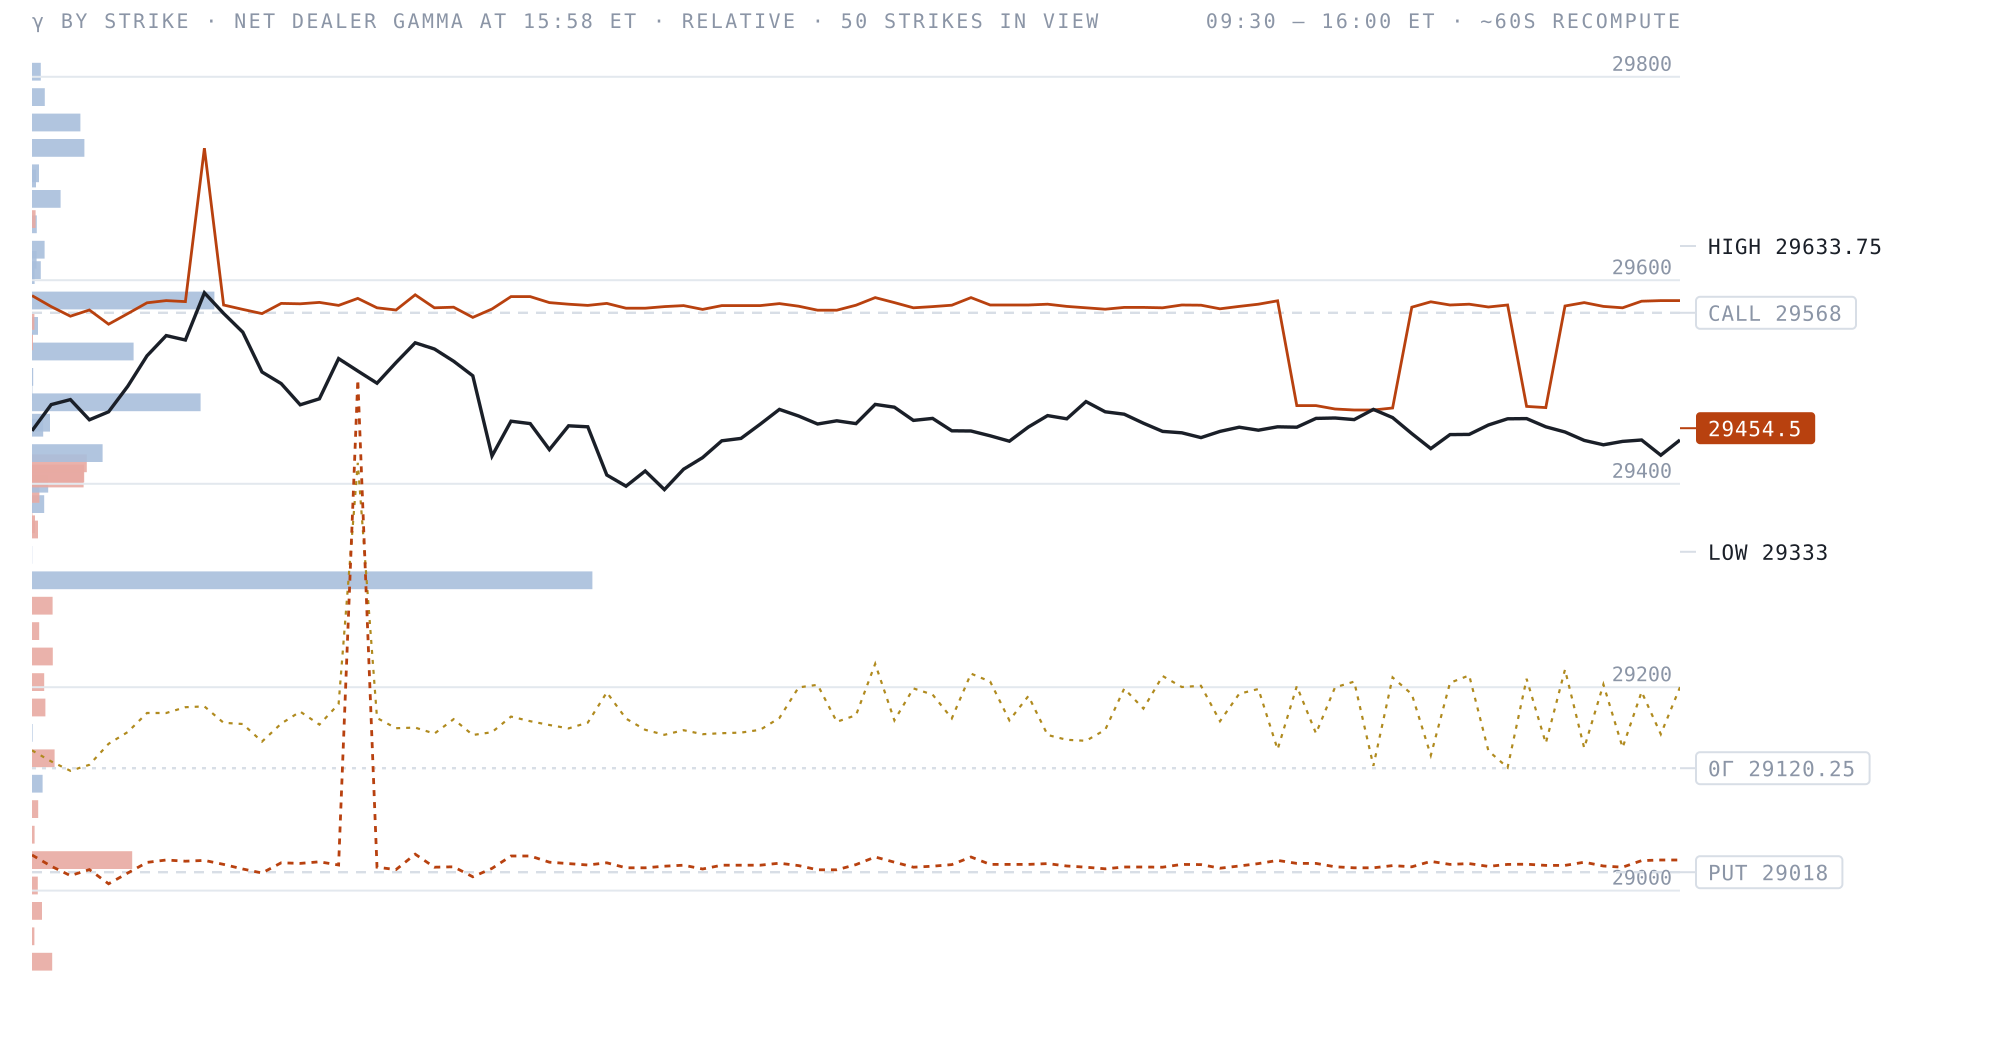
The close read, from the gamma engine
This is a real end-of-session read from my own OI-derived gamma engine — where the walls sat when the bell went, published once a day and never retouched. What it can't show you is the session itself: in the terminal these levels rebuild about every minute on your own chart, next to the DOM, the footprint and the tape, with the zero-gamma line and the full strike profile. The walls move all day. This page shows you where they ended up; Pro shows you while it's happening.
OI-derived dealer-gamma estimate · published once after the close here, rebuilt ~60s in the terminal · informational, not advice
$125/mo — or $94/mo billed annually
What you are reading here is free and stays free. Pro is the live one: these walls and the full strike profile rebuilt about every minute while the session runs, on the same chart as the DOM, the footprint and the tape — and drawn inside your own charting software too.
