footprint chart software
Footprint V2 splits every candle into bid and ask volume at each price, colours the imbalances, flags the stacked ones, draws the delta profile and detects absorption, in five rendering modes. It runs natively on Windows 10 and 11 and on macOS on Apple Silicon, as part of a terminal where the DOM ladder, the TPO profile and the dealer-gamma walls sit on the same screen and follow the same symbol. Measured at about 60 frames a second under roughly 200 prints a second.
The problem
On most stacks the footprint arrives as a module with its own price, on top of the platform and the data. It should be part of the terminal, not a line item.
Is the delta at this price from buyers pressing or sellers giving up? Where did the volume cluster? What did the range look like? A footprint that only shows one rendering answers one question and hides the others.
A footprint that repaints every cell on every print falls over exactly when the flow you bought it for arrives. The number that matters is the frame rate under a tick storm, and it should be measured, not promised.
What Sharpnel does
Delta, Profile, Heatmap, Range and Volume. Each mode is a different question about the same bar, and you switch in place to look at one candle from several angles instead of opening another panel.
Bid and ask volume at every price, imbalance colouring, stacked imbalances flagged with their own border, a delta profile for the bar and absorption detection where one side keeps printing into the other without price moving.
The ladder carries its own footprint band beside the book, at 1, 3 or 5 minute bars, remembered per symbol, built from the one-minute record. The dark ladder shows size on the same lightness curve as the light one, so the biggest bids and offers stand out on black as they do on white.
The call wall, the put wall and the gamma flip are recomputed about every 60 seconds and drawn through the footprint at their live prices. The DOM ladder and the TPO panel follow the same symbol, so an absorption print at a call wall is one picture rather than three windows.
A native desktop terminal, not a browser tab and not a Java runtime: Windows 10 and 11, and macOS 14 or later on Apple Silicon. On the shipping build the live tape holds about 60 frames a second under roughly 200 prints a second, and the release gate refuses any build over 40 ms p95.
Custom studies written in C++ compile inside the terminal and read the same bid and ask volume and delta the footprint draws, at native speed, on Windows.
| The job | A footprint add-on | Sharpnel Footprint V2 |
|---|---|---|
| Price | A module on top of the platform and the data | Part of Pro, $125 a month |
| Views | One or two | Five modes on the same bar, and a footprint band on the DOM |
| The dealer walls | Not there | Drawn through the footprint, recomputed intraday |
| Under a tick storm | Unpublished | ~60 fps at ~200 prints a second, measured on every release |
| Platform | Often a runtime on top of Windows | Native on Windows 10 and 11, and on macOS |
You pay your own broker or exchange market-data fees where your platform requires them.
ES and NQ as captured at 08:30 ET, every trading day, and after the close whether they held. Free, one mail a day, unsubscribe anytime.
Pharos · September 9, 2026 · NQ · 09:58 ET
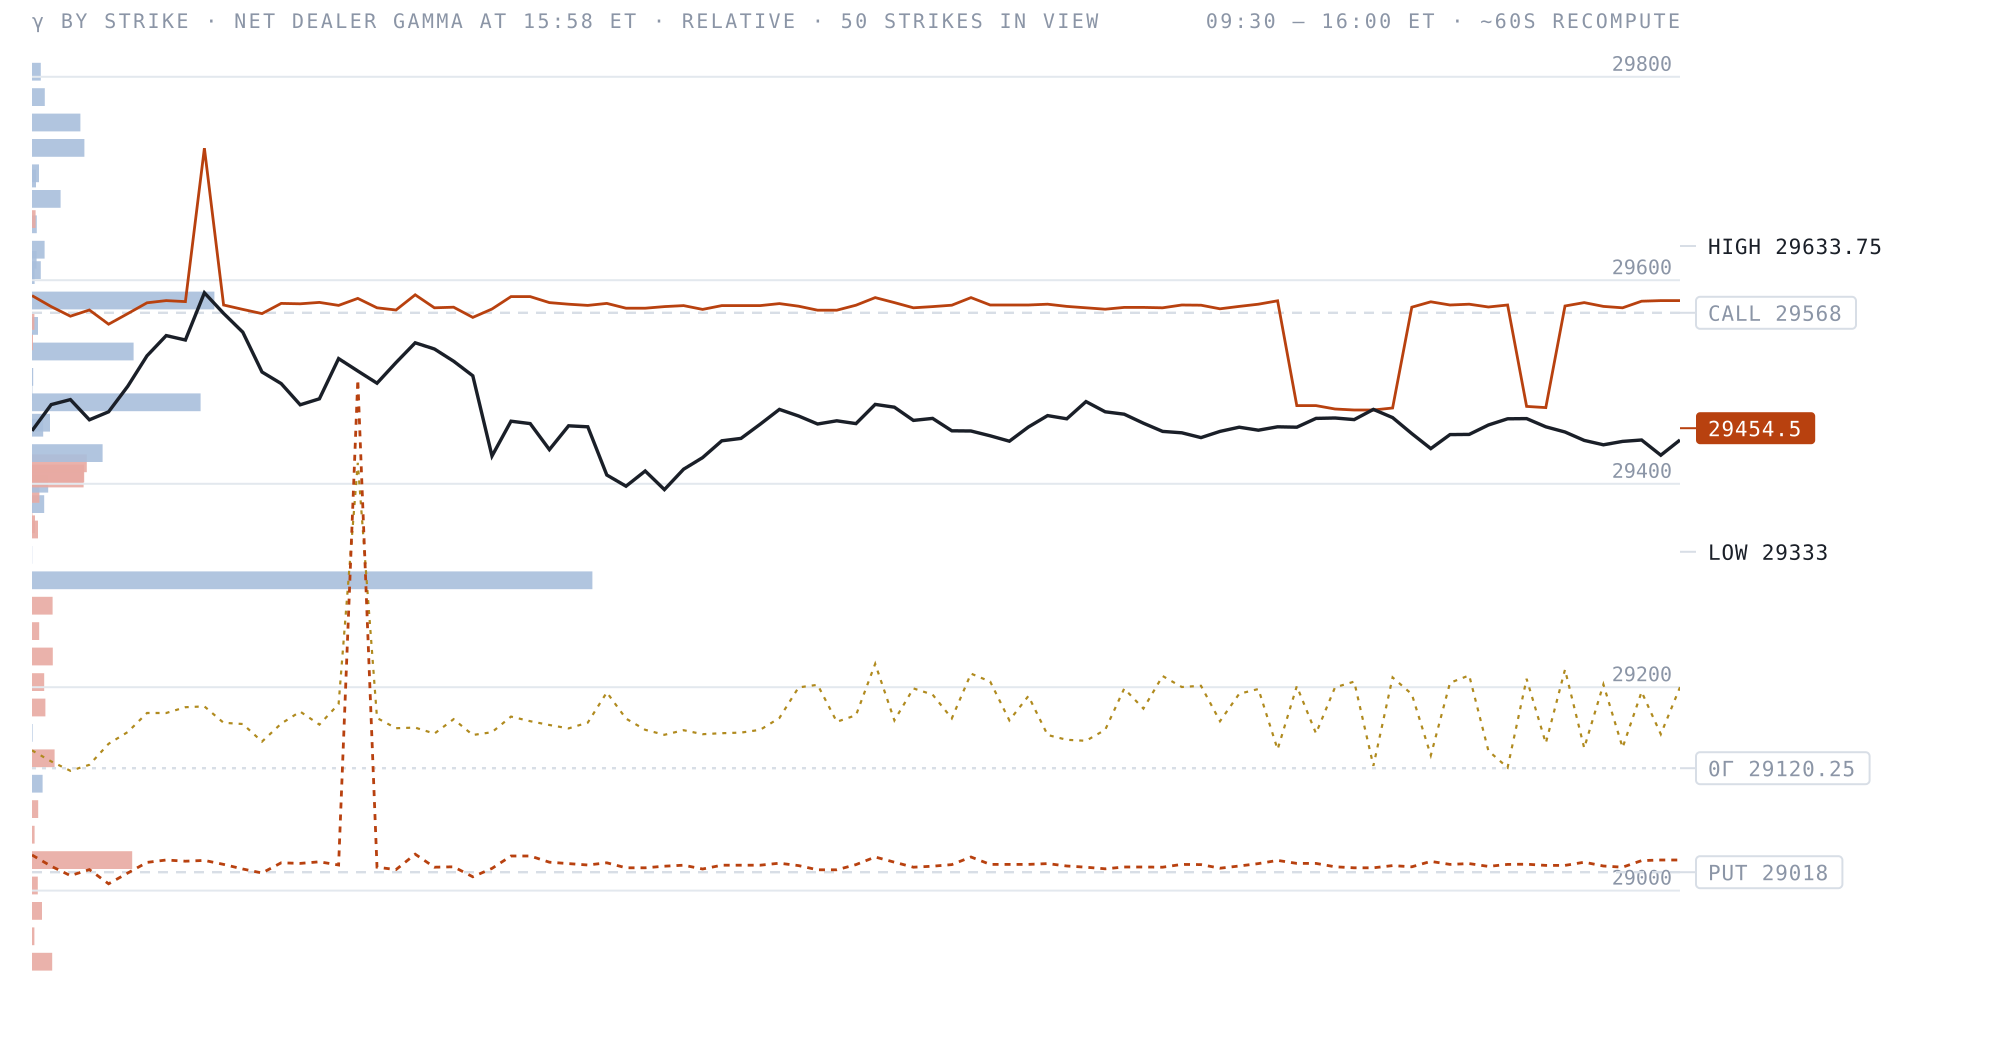
“Wednesday's receipt. The call wall on NQ was 29568. Price reached it at 9:58 a.m. Eastern, returned at 10:44 a.m. Eastern, and this time it gave way. The session high was 29633.75.”
The close read, from the gamma engine
This is a real end-of-session read from my own OI-derived gamma engine — where the walls sat when the bell went, published once a day and never retouched. What it can't show you is the session itself: in the terminal these levels rebuild about every minute on your own chart, next to the DOM, the footprint and the tape, with the zero-gamma line and the full strike profile. The walls move all day. This page shows you where they ended up; Pro shows you while it's happening.
OI-derived dealer-gamma estimate · published once after the close here, rebuilt ~60s in the terminal · informational, not advice
$125/mo — or $94/mo billed annually
What you are reading here is free and stays free. Pro is the live one: these walls and the full strike profile rebuilt about every minute while the session runs, on the same chart as the DOM, the footprint and the tape — and drawn inside your own charting software too.
