order flow trading software
Sharpnel is a desktop terminal for Windows and macOS built around the order flow on ES, NQ and the rest of the futures complex: a full-depth DOM ladder with a Pull/Stack column, a footprint with five rendering modes, TPO and Market Profile, a reconstructed tape with cumulative delta, and the dealer-gamma walls drawn through all of it, recomputed about every 60 seconds. Pro is $125 a month, or $1,125 for the year paid once. Here is exactly what is in the box.
The problem
A typical order-flow desk is a platform subscription, a separate market-data invoice, a positioning service in a browser tab and a charting app. Each is fine alone. Together they are four windows that do not know about each other.
When the DOM comes from one vendor and the footprint from another, the two are built from different feeds on different clocks, and the discrepancy you are staring at is plumbing, not the market.
Any platform looks fine at lunch. The question is what the ladder does under a few hundred prints a second at the open, and most vendors do not publish that number.
What Sharpnel does
A full-depth ladder with the column other ladders forgot: Pull/Stack shows what is being pulled out of the book and stacked in, live. Classified prints, a reconstructed tape, DOM volume bars, multi-timeframe value area and persistent VWAP, POC and gamma overlays that survive the scroll. The multi-dom preset opens four ladders side by side.
Bid and ask volume at every price inside every candle, imbalance colouring with stacked imbalances flagged, a delta profile and absorption detection, in five rendering modes: Delta, Profile, Heatmap, Range and Volume. The DOM carries its own footprint band at 1, 3 or 5 minute bars, remembered per symbol.
A full-canvas TPO panel with four period columns, letters or volume bars, point of control and value area on every column. A reconstructed time and sales tape with size-weighted flash and cumulative delta. A liquidity heatmap of resting depth over time. A chart family with volume profile, session levels, VWAP bands and gap-bridge candles.
The call wall, the put wall and the gamma flip are recomputed about every 60 seconds from the live option chain and drawn through the ladder, the footprint, the profile and the chart. Pharos, the terminal's voice, says when price reaches a wall and what the ladder is doing there, and stays quiet otherwise.
On the shipping build the chart pans at 12.8 ms p95 fully loaded, the live tape holds about 60 frames a second under roughly 200 prints a second, and in a 20-chart workspace the worst chart holds 7.5 ms p95. Every release must beat 40 ms p95 or it does not ship. The figures and how they are taken are on the performance page.
Native custom studies compile inside the terminal against one frozen header and read the same bid and sell volume and delta the footprint draws, on Windows. And if you would rather keep your charting platform, a bridge study draws the same walls inside six of them with one key.
| The job | A separate order-flow platform | Sharpnel |
|---|---|---|
| The ladder | Size at each price, right now | Size, plus what is being pulled and stacked, live |
| The footprint | One or two views | Five modes, and a footprint band on the DOM itself |
| The dealer walls | In another tool | Drawn through the ladder, the footprint and the profile, recomputed intraday |
| Performance under load | Unpublished | Measured on every release, published, gated at 40 ms p95 |
| The bill | Platform, plus data, plus the levels elsewhere | $125 a month; your broker or exchange data fees stay yours |
The comparison describes the common shape of a separate-tools desk, not any one vendor. Click-to-trade is simulated by default; live execution stays in your own broker account.
ES and NQ as captured at 08:30 ET, every trading day, and after the close whether they held. Free, one mail a day, unsubscribe anytime.
Pharos · September 9, 2026 · NQ · 09:58 ET
“Wednesday's receipt. The call wall on NQ was 29568. Price reached it at 9:58 a.m. Eastern, returned at 10:44 a.m. Eastern, and this time it gave way. The session high was 29633.75.”
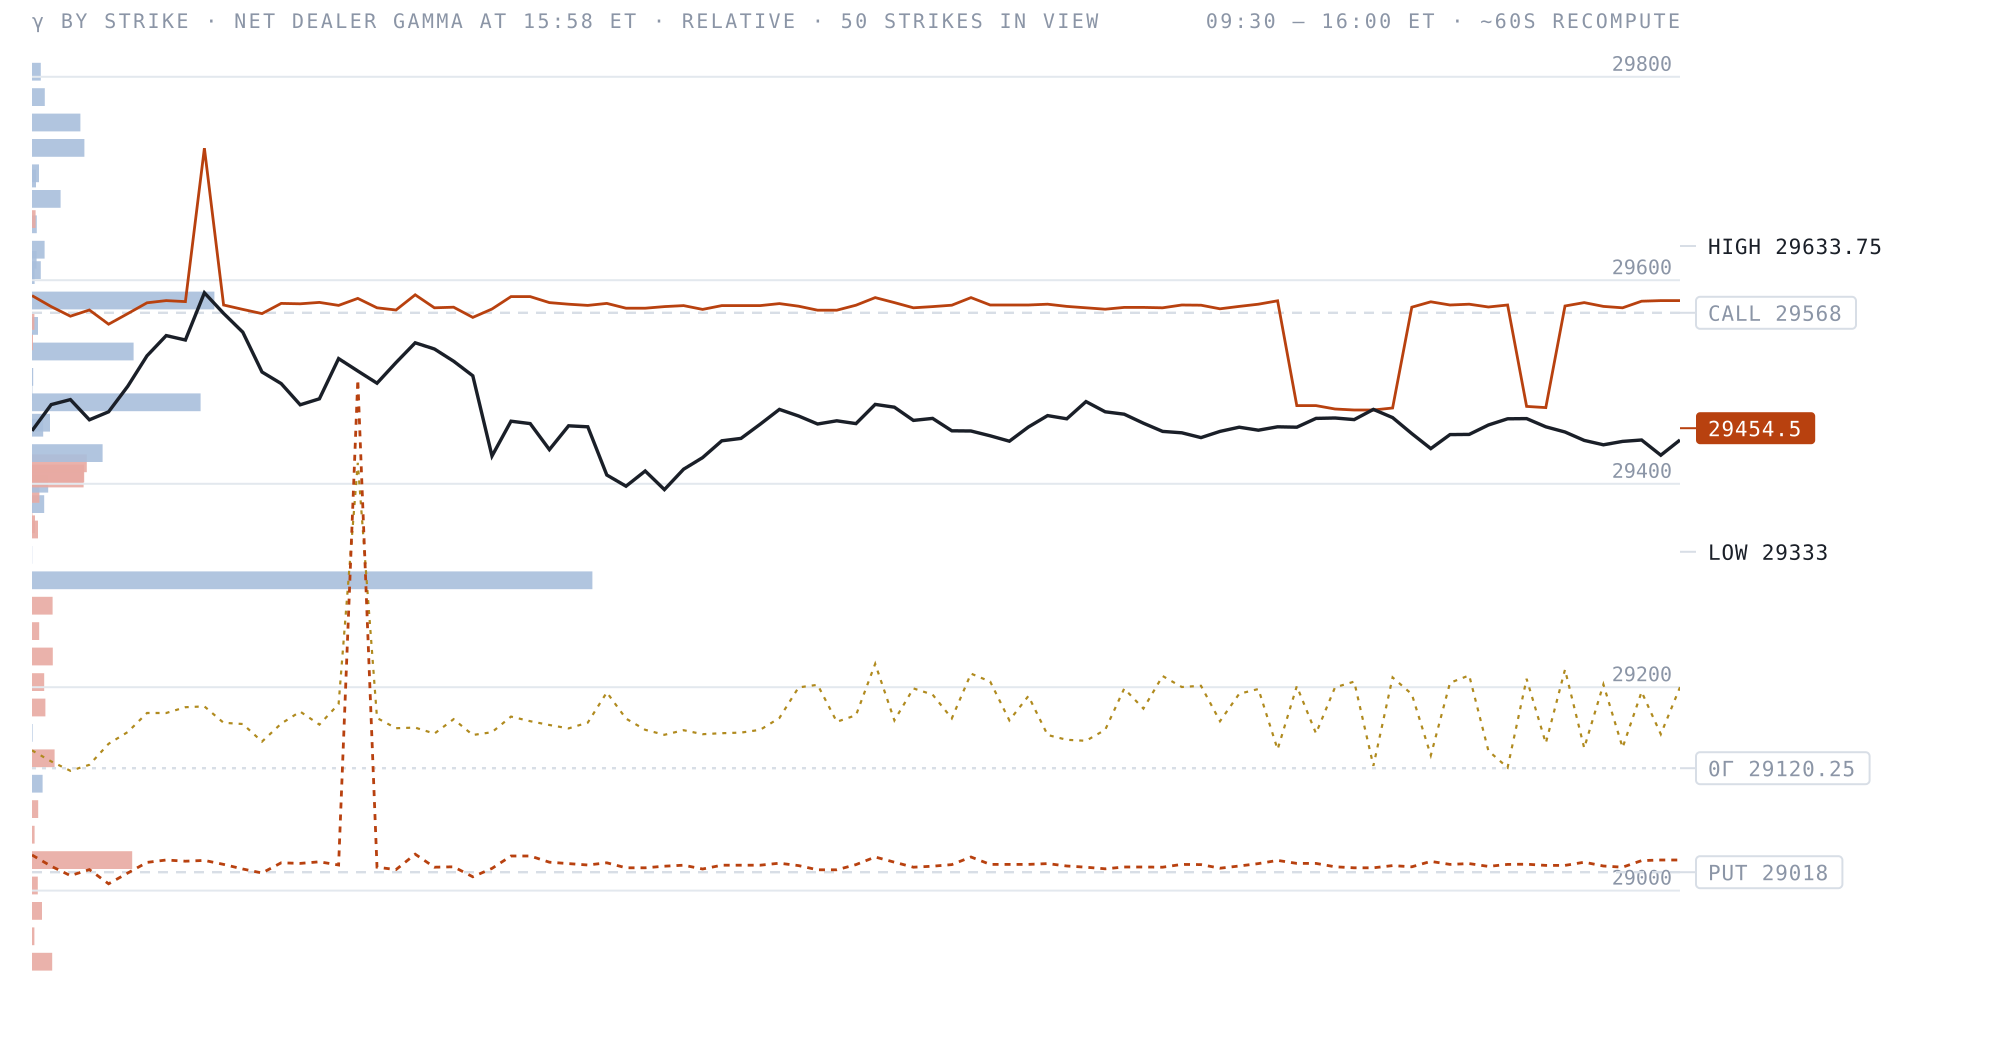
The close read, from the gamma engine
This is a real end-of-session read from my own OI-derived gamma engine — where the walls sat when the bell went, published once a day and never retouched. What it can't show you is the session itself: in the terminal these levels rebuild about every minute on your own chart, next to the DOM, the footprint and the tape, with the zero-gamma line and the full strike profile. The walls move all day. This page shows you where they ended up; Pro shows you while it's happening.
OI-derived dealer-gamma estimate · published once after the close here, rebuilt ~60s in the terminal · informational, not advice
$125/mo — or $94/mo billed annually
What you are reading here is free and stays free. Pro is the live one: these walls and the full strike profile rebuilt about every minute while the session runs, on the same chart as the DOM, the footprint and the tape — and drawn inside your own charting software too.
