trading stack cost
A dealer-positioning service, an order-flow platform, a charting subscription, sometimes an options tool and a journal: the usual desk is four or five bills, and traders put the total between $300 and $500 a month before broker fees. Here is the same desk role by role, what each role typically costs, and what it is in Sharpnel, where the whole thing is $125 a month or $1,125 for the year paid once. The one thing that stays yours either way is the broker or exchange market-data fee.
The problem
A positioning service at the price of a data plan, a platform at the price of a phone contract, a charting app at the price of a streaming bundle. None of them is expensive alone. Together they are a monthly tax on having an order-flow thesis, before a single trade.
The levels live in one product, the ladder in another, the chart in a third. Nothing shares a symbol, nothing shares a clock, and you are the integration layer.
The reason most traders keep paying for the stack is that the platform with the layouts and hotkeys is not negotiable. A consolidated alternative has to work with that platform, not replace it.
What Sharpnel does
Nine dealer-gamma level types recomputed about every 60 seconds from the live option chain and drawn on the chart, where a positioning service on its own runs roughly $90 to $300 a month for the levels alone. Today's ES and NQ walls are free regardless, graded every session in public.
DOM V2 with Pull/Stack, classified prints and a reconstructed tape; Footprint V2 in five modes; a four-column TPO panel; the liquidity heatmap; the chart family. Real-time, full-depth order flow on the major futures is part of Pro, with no separate analytics invoice from me.
The chain with per-strike and aggregate Greeks, the vol surface, the payoff analyzer; a journal with analytics boards and a risk cockpit; and Pharos, the voice that says what is moving your market in ten languages. None of these is an add-on.
If the platform with your layouts is the one thing you will not give up, a bridge study draws the same walls inside Sierra Chart, NinjaTrader 8, Quantower, ATAS, MotiveWave or Bookmap with one key, and the terminal runs beside it and talks. The studies are part of Pro.
| The job | The usual stack | Sharpnel Pro, $125 a month |
|---|---|---|
| Dealer-gamma levels | A positioning service, roughly $90 to $300 a month, levels only | Nine level types, recomputed ~60s, on the chart, included |
| DOM, footprint, tape, profile | An order-flow platform, plus often a data invoice | DOM V2, Footprint V2, TPO, the tape, the heatmap, included |
| Charting | A charting subscription | The chart family, included; or keep yours and add the walls with a study |
| Options | Another tool, if at all | Chain, Greeks, vol surface, payoff analyzer, included |
| Journal, risk | A spreadsheet or another subscription | Journal, analytics boards, risk cockpit, included |
| Broker and exchange data fees | Yours | Still yours |
| The total | Roughly $300 to $500 a month, illustrative | $125 a month, or $1,125 the year paid once |
Illustrative of a common four-tool setup; your exact tools and costs vary. You pay your own broker or exchange market-data fees where your platform requires them.
ES and NQ as captured at 08:30 ET, every trading day, and after the close whether they held. Free, one mail a day, unsubscribe anytime.
Pharos · September 9, 2026 · NQ · 09:58 ET
“Wednesday's receipt. The call wall on NQ was 29568. Price reached it at 9:58 a.m. Eastern, returned at 10:44 a.m. Eastern, and this time it gave way. The session high was 29633.75.”
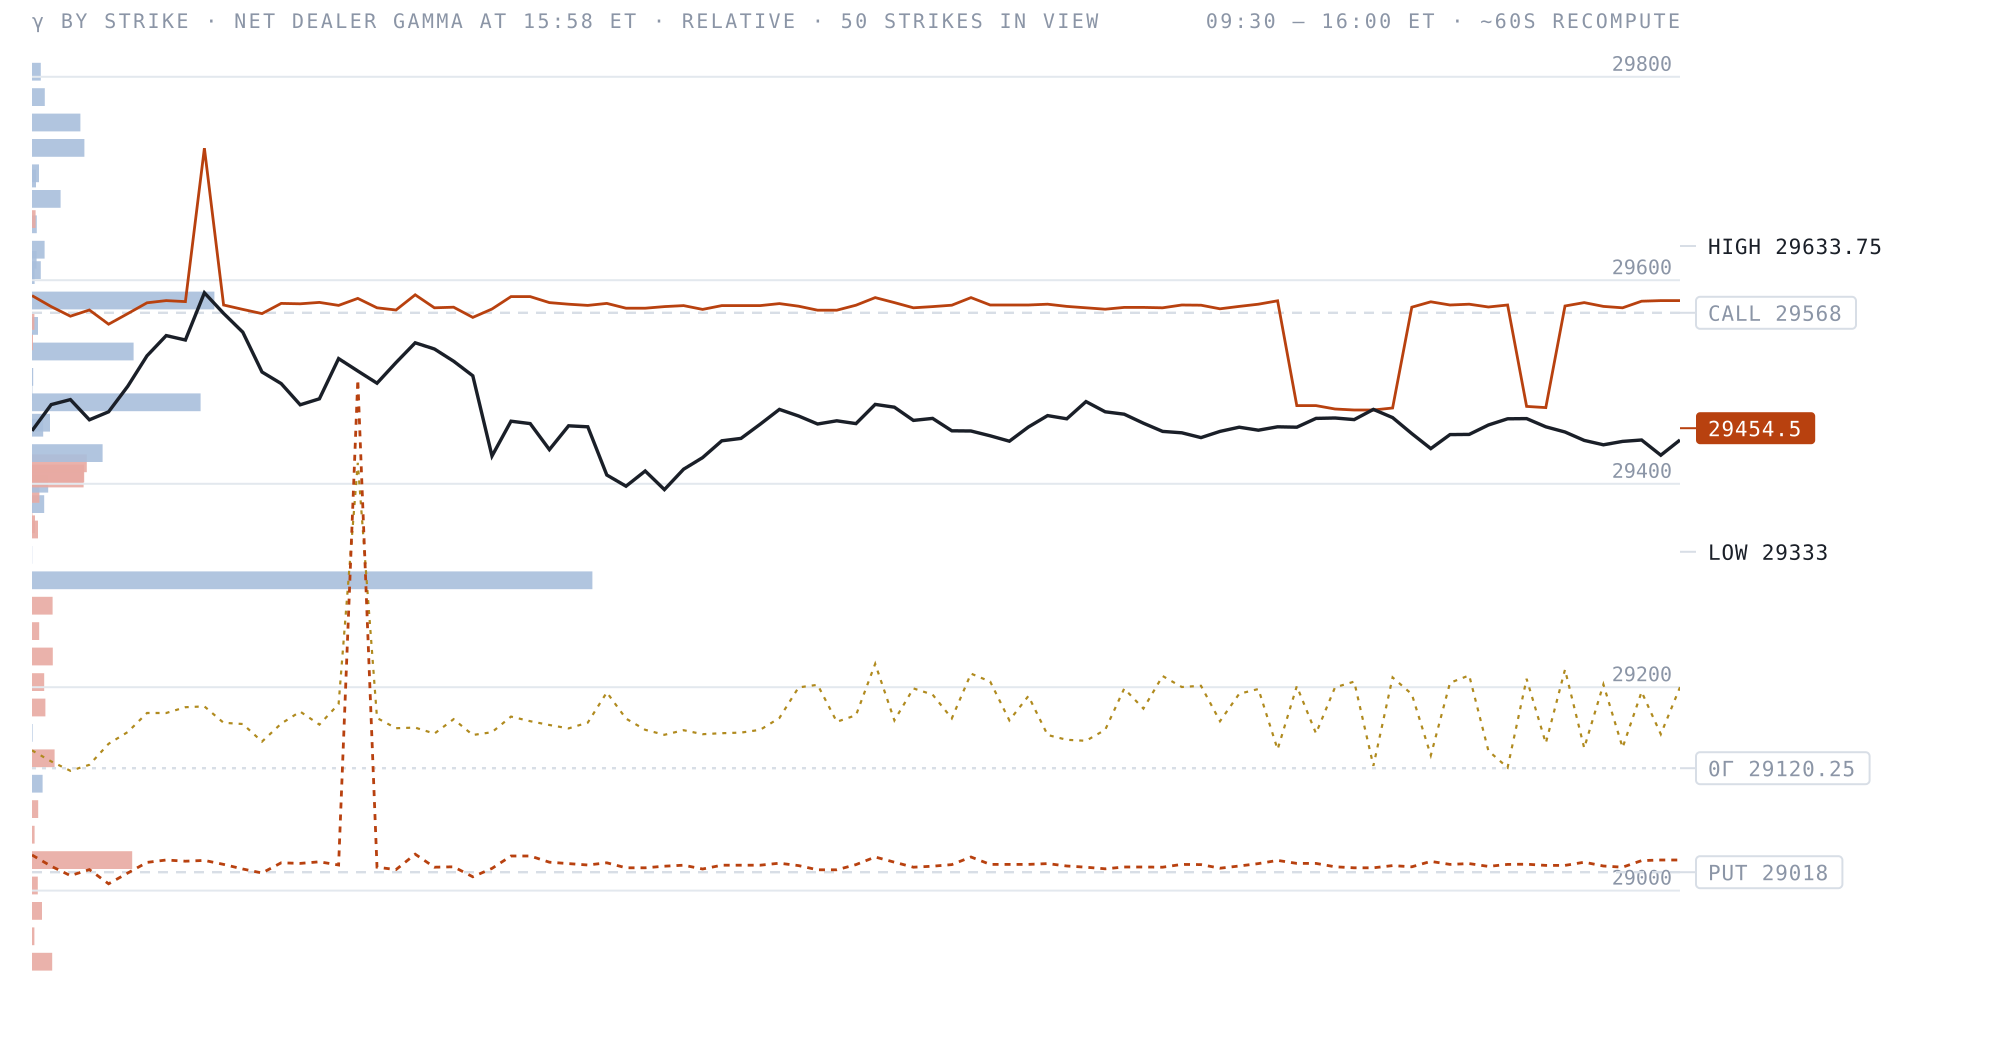
The close read, from the gamma engine
This is a real end-of-session read from my own OI-derived gamma engine — where the walls sat when the bell went, published once a day and never retouched. What it can't show you is the session itself: in the terminal these levels rebuild about every minute on your own chart, next to the DOM, the footprint and the tape, with the zero-gamma line and the full strike profile. The walls move all day. This page shows you where they ended up; Pro shows you while it's happening.
OI-derived dealer-gamma estimate · published once after the close here, rebuilt ~60s in the terminal · informational, not advice
$125/mo — or $94/mo billed annually
What you are reading here is free and stays free. Pro is the live one: these walls and the full strike profile rebuilt about every minute while the session runs, on the same chart as the DOM, the footprint and the tape — and drawn inside your own charting software too.
