cheapest real time gex
Start at $0: today's ES and NQ call wall, put wall and gamma flip are published free every morning at 08:30 ET, graded at 4:15 pm ET, and served to assistants by a free MCP server; the free Explorer desk draws them on a delayed chart. The rung after that is the only real-time one: $125 a month, or $1,125 for the year paid once, for the levels recomputed about every 60 seconds and drawn on the chart you trade, in the terminal or inside six other charting platforms, with the DOM ladder and the footprint included. Above that, $345 a month buys the computed feed itself.
The problem
The lower tier of most services is one computation before the open. Real-time is where the price jumps, because that is where the value is: the surface rebuilds through the session as 0DTE flow prints, and a wall from 8am is a rumour by 11.
Even a reasonably priced positioning service still needs a charting platform, an order-flow tool and a data subscription beside it. The cost of the levels is the cost of everything you have to run to use them.
A free tier that shows one symbol on one day cannot tell you whether the method is any good. Free has to include the record, or it is a demo.
What Sharpnel does
Today's ES and NQ walls are captured at 08:30 ET, published on the levels page and on a page per contract, and frozen. Seven more instruments have their own free pages. Every ES and NQ wall since July 2026 is graded on one record page, misses included, with a JSON copy. A free MCP server hands the same numbers to any assistant with no key. The morning walls can arrive by email at 08:50 ET.
No card, no time limit, 15-minute delayed data. The free desk opens on the chart, the watchlist, the calendar and the newswire, and draws the 08:30 walls on the chart, so the morning levels are on a chart you can scroll before you pay anything.
Nine level types recomputed about every 60 seconds from the live option chain and drawn on the chart at their live prices, on ES, NQ, SPX and the other names the chain covers. The DOM ladder, the footprint, the TPO panel, the tape and the options workspace are in the same price, and so are the bridge studies that draw the walls inside Sierra Chart, NinjaTrader 8, Quantower, ATAS, MotiveWave or Bookmap. Paid for the year at once it is $1,125, no renewal.
The Quant API includes everything in Pro plus REST access to the computed dealer-gamma feed: per-strike gamma ladders, 365 days of history, positioning statistics and raised rate limits. For personal use; the data may not be resold or redistributed.
| The job | Elsewhere, typically | Here |
|---|---|---|
| Today's walls | A sample, or a lower tier | Free: ES, NQ and seven more instruments, 08:30 ET, graded |
| The record and the method | Not published | Free: every wall since July, misses included; the methodology page |
| Real-time levels | The higher tier, roughly $90 to $300 a month, levels only | $125 a month, recomputed ~60s, on the chart, with the DOM, footprint, TPO and options |
| The feed | Enterprise pricing, if at all | $345 a month, personal use |
Competitor pricing is illustrative of common dealer-positioning services; your exact tools and costs vary. Broker and exchange market-data fees are yours where your platform requires them.
ES and NQ as captured at 08:30 ET, every trading day, and after the close whether they held. Free, one mail a day, unsubscribe anytime.
Pharos · September 9, 2026 · NQ · 09:58 ET
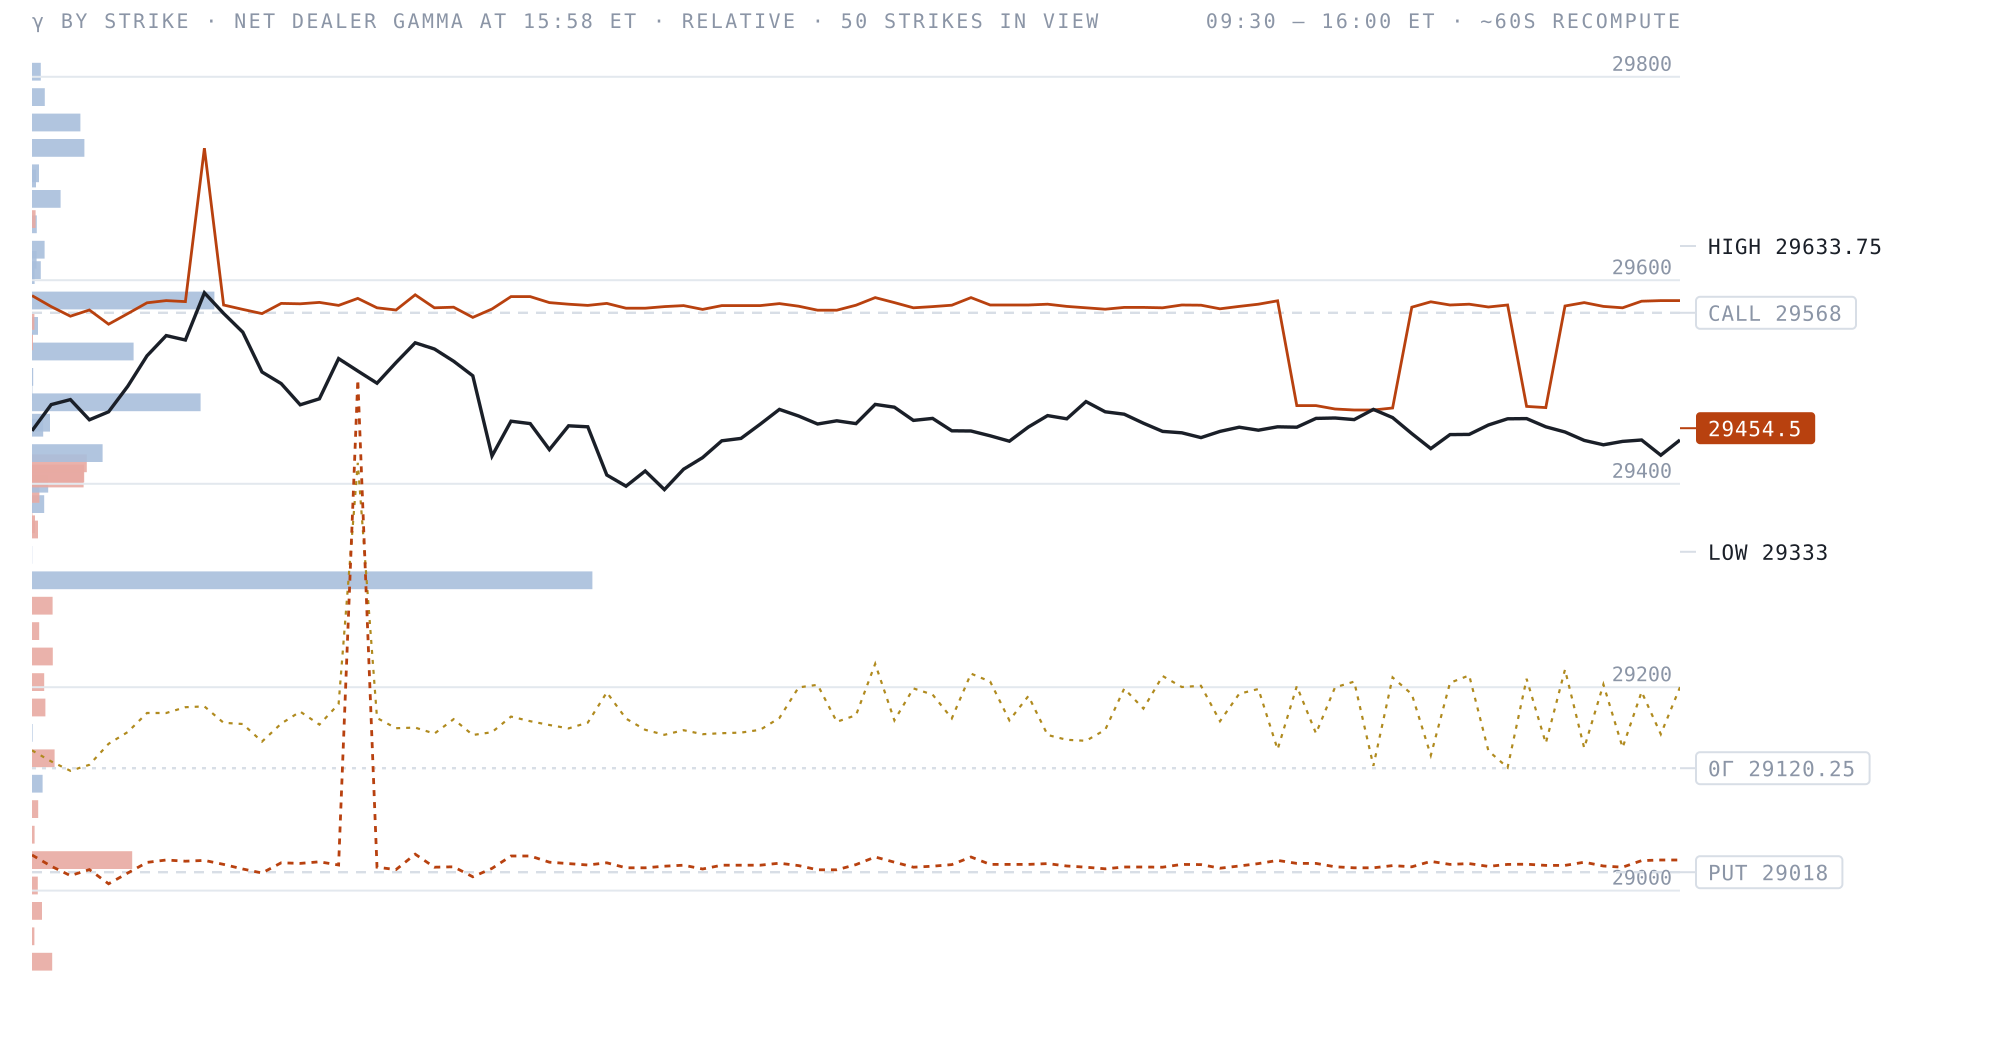
“Wednesday's receipt. The call wall on NQ was 29568. Price reached it at 9:58 a.m. Eastern, returned at 10:44 a.m. Eastern, and this time it gave way. The session high was 29633.75.”
The close read, from the gamma engine
This is a real end-of-session read from my own OI-derived gamma engine — where the walls sat when the bell went, published once a day and never retouched. What it can't show you is the session itself: in the terminal these levels rebuild about every minute on your own chart, next to the DOM, the footprint and the tape, with the zero-gamma line and the full strike profile. The walls move all day. This page shows you where they ended up; Pro shows you while it's happening.
OI-derived dealer-gamma estimate · published once after the close here, rebuilt ~60s in the terminal · informational, not advice
$125/mo — or $94/mo billed annually
What you are reading here is free and stays free. Pro is the live one: these walls and the full strike profile rebuilt about every minute while the session runs, on the same chart as the DOM, the footprint and the tape — and drawn inside your own charting software too.
