custom studies sdk
Sharpnel's studies SDK is one frozen C header and a compiler that ships inside the terminal. You write a study in C or C++ in the built-in Study Editor, press Compile & Load, and it lands on the live chart as a first-class study beside the built-ins, at native speed, reading the same bars, bid and ask volume and delta the footprint draws. A study that faults is disabled for the session and the terminal stays up. The SDK is part of Pro, on Windows, with nothing to install.
The problem
Bolt-on indicator languages are interpreted, single-threaded and sandboxed away from the order flow. Per-bar delta divergence or absorption scoring across a footprint is exactly the work they choke on, and the workaround is always a slower version of the idea.
Most native SDKs begin with installing a compiler, matching a runtime, and finding out which header version the platform was built against. The study you wanted to write is the second afternoon.
A native study that writes out of bounds should not be able to close your ladder in the middle of a session. If the host does not isolate it, every study you load is a bet on your own code.
What Sharpnel does
Your study compiles against a single pure-C header: plain-old-data structs and function pointers, with no Qt, no Skia and no STL crossing the boundary. The ABI is versioned and evolves additively, so a study built today keeps loading as the terminal updates; a breaking change bumps the major version and the host refuses the mismatch cleanly instead of crashing.
Open the Study Editor, write the study, press Compile & Load (Ctrl+Enter): it builds and hot-loads onto the active chart on a fresh install, with no toolchain to install. Prefer your own? Studies also build externally with MSVC, x64 Release, dynamic CRT, and drop in as a DLL.
Studies run in-process and are computed off the render thread, so a heavy study cannot stutter the chart. They read the series the terminal draws: open, high, low, close, volume, buy and sell volume, delta and the price source, and they recompute only when the data or your inputs change.
The host owns every output buffer and plants a canary around it. A study that faults or writes out of bounds is fault-disabled for the session; the terminal stays up.
Up to 16 subgraphs per study in line, histogram, area, dots, band and step styles, plus reference levels and drawings. Declare int, double, bool, enum, colour and price-source inputs and the terminal renders the settings dialog for you. SMA, EMA, RSI and Delta ship on the same SDK.
The SDK, the editor and the compiler are included in Pro at $125 a month, or $1,125 for the year paid once. Custom studies are a Windows feature today; the terminal itself runs on Windows and macOS.
| The job | A scripting layer | Sharpnel studies SDK |
|---|---|---|
| Language | A proprietary script, interpreted | C or C++, compiled, native speed |
| Getting started | Learn the dialect | One header; the compiler is in the terminal |
| The data | Bars, usually | Bars, bid and ask volume, delta, price source |
| A bug in your study | A frozen platform, sometimes | The study is disabled for the session; the terminal stays up |
| Price | Often a paid add-on or a higher tier | Part of Pro |
Custom studies are a Windows feature today. You pay your own broker or exchange market-data fees where your platform requires them.
ES and NQ as captured at 08:30 ET, every trading day, and after the close whether they held. Free, one mail a day, unsubscribe anytime.
Pharos · September 9, 2026 · NQ · 09:58 ET
“Wednesday's receipt. The call wall on NQ was 29568. Price reached it at 9:58 a.m. Eastern, returned at 10:44 a.m. Eastern, and this time it gave way. The session high was 29633.75.”
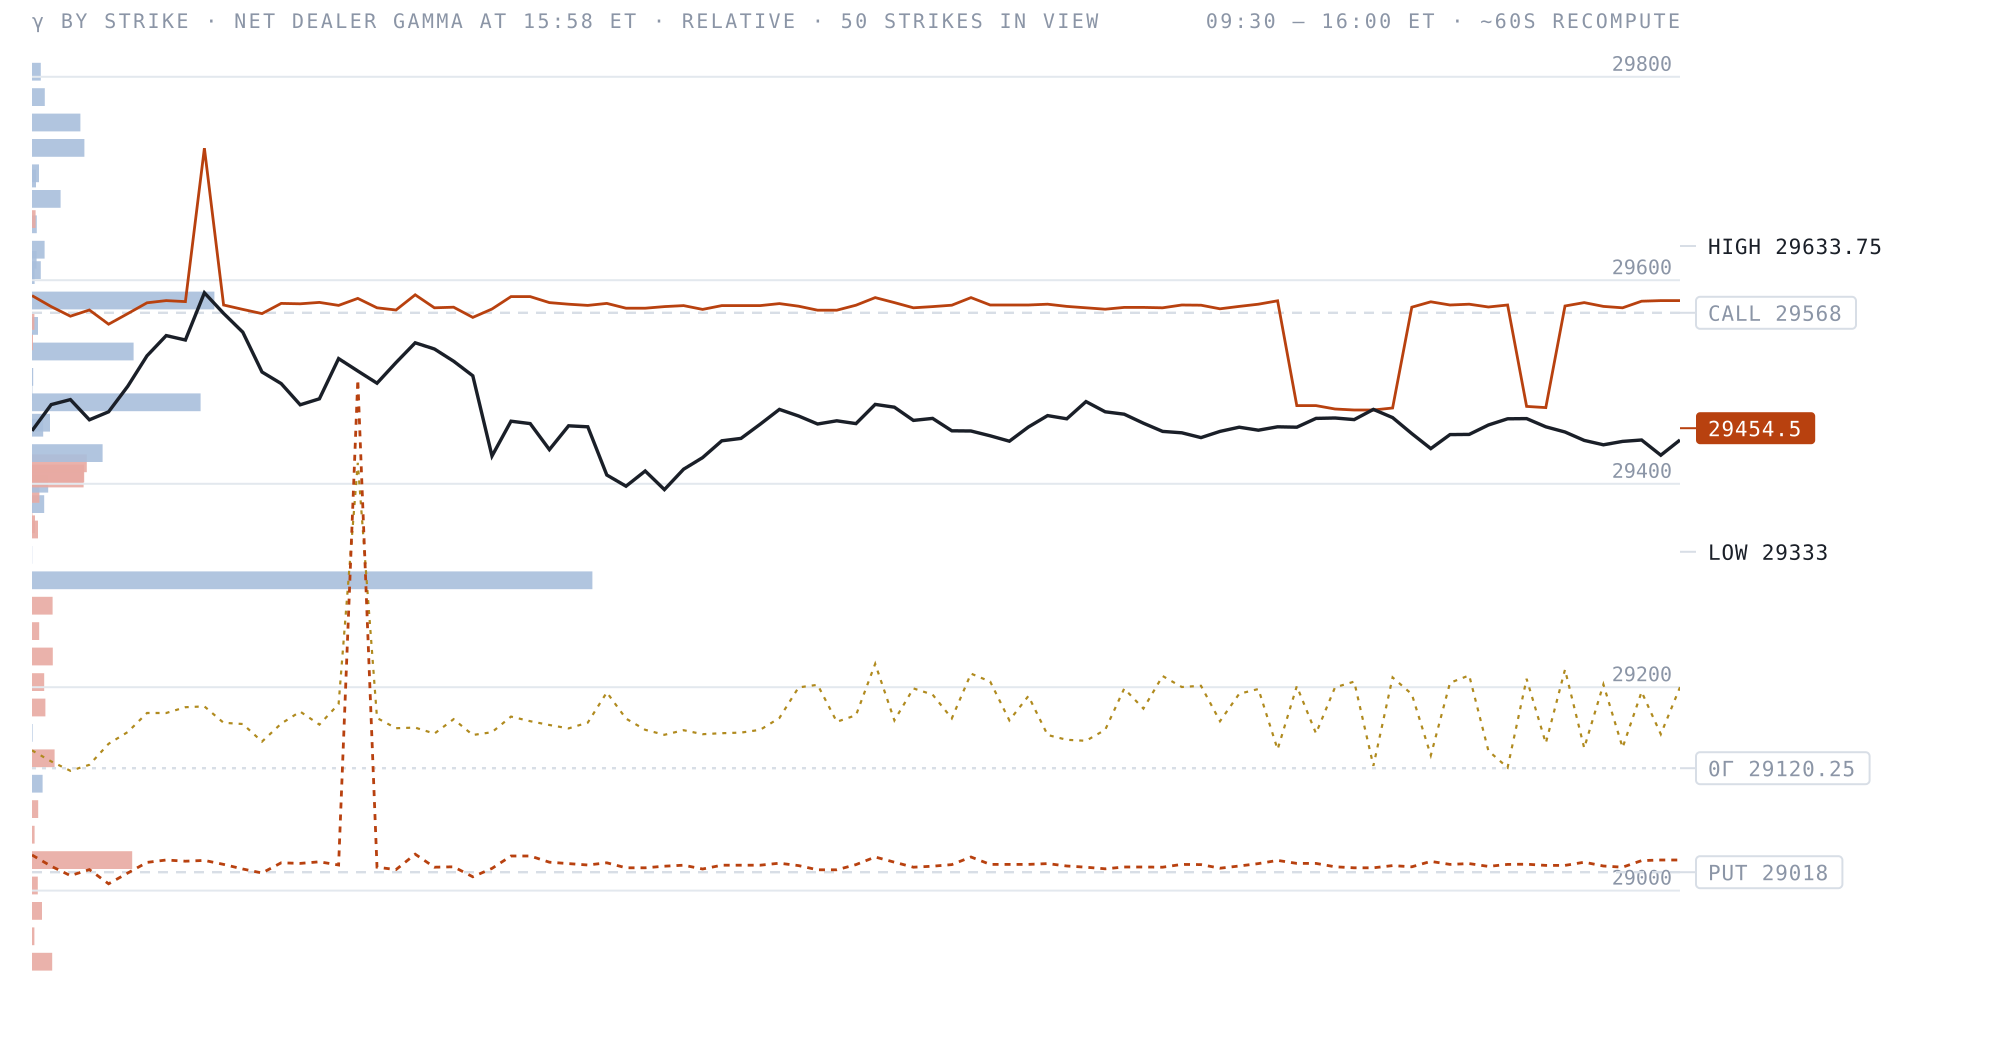
The close read, from the gamma engine
This is a real end-of-session read from my own OI-derived gamma engine — where the walls sat when the bell went, published once a day and never retouched. What it can't show you is the session itself: in the terminal these levels rebuild about every minute on your own chart, next to the DOM, the footprint and the tape, with the zero-gamma line and the full strike profile. The walls move all day. This page shows you where they ended up; Pro shows you while it's happening.
OI-derived dealer-gamma estimate · published once after the close here, rebuilt ~60s in the terminal · informational, not advice
$125/mo — or $94/mo billed annually
What you are reading here is free and stays free. Pro is the live one: these walls and the full strike profile rebuilt about every minute while the session runs, on the same chart as the DOM, the footprint and the tape — and drawn inside your own charting software too.
