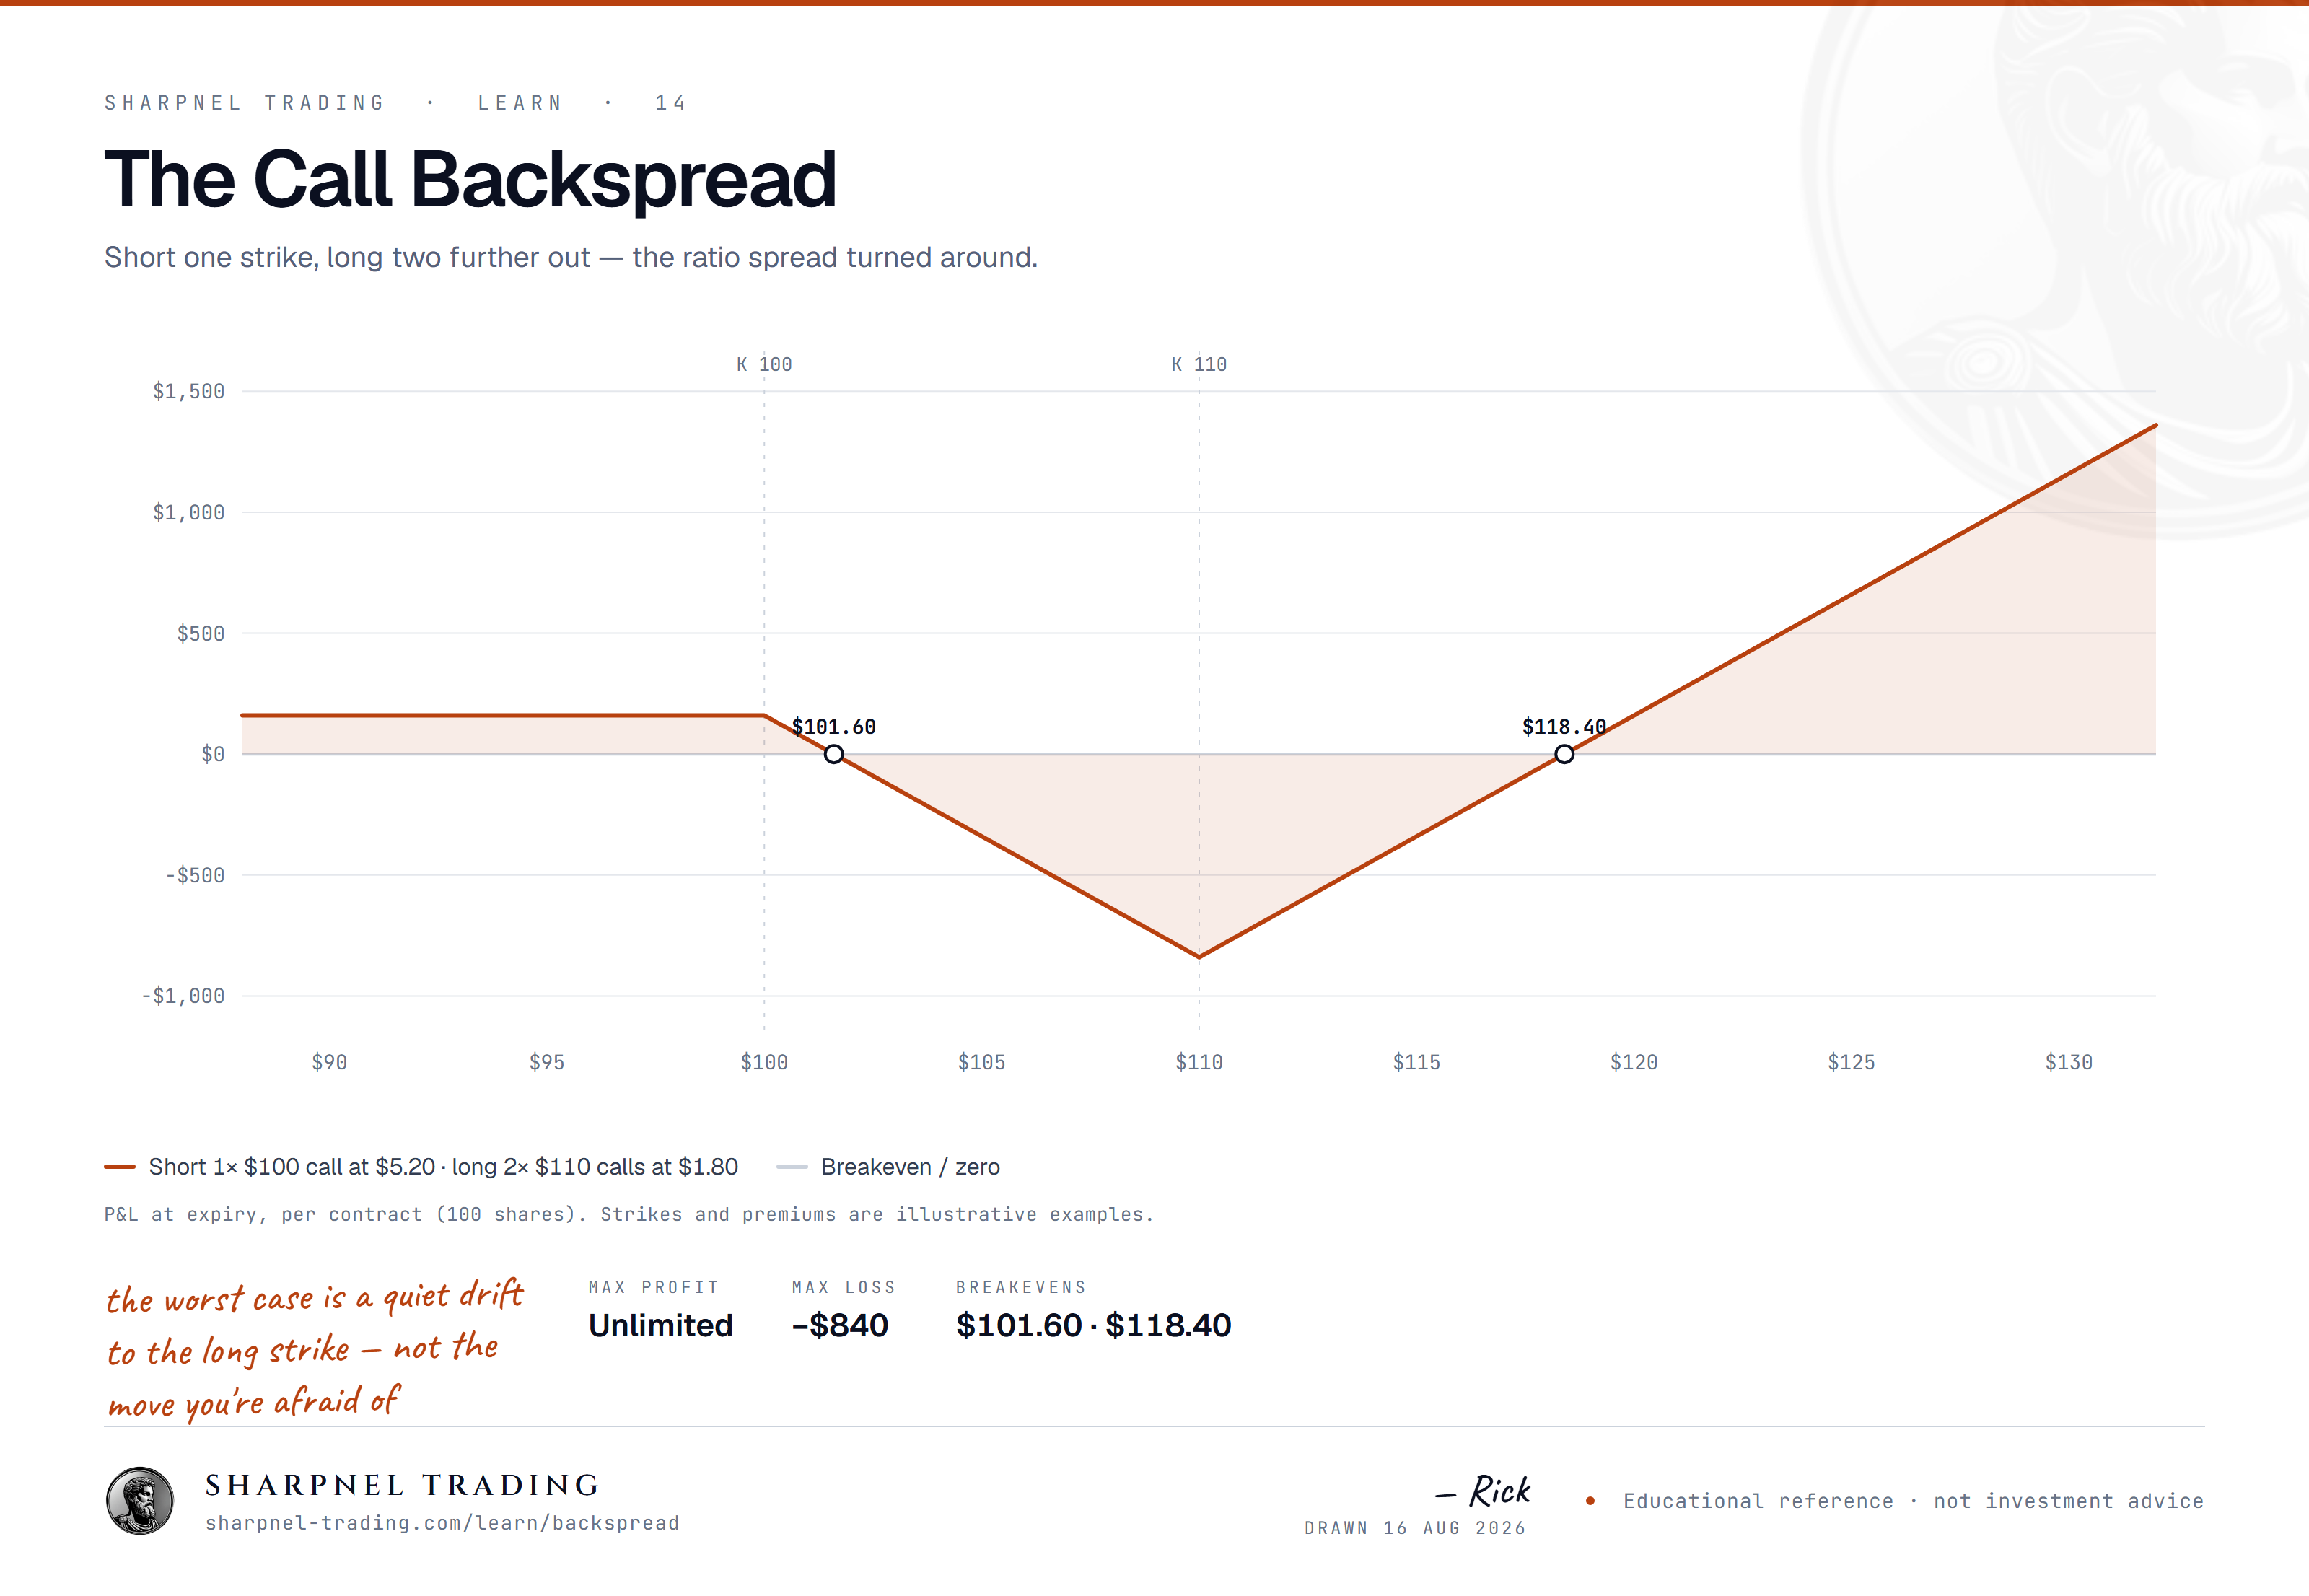
A backspread is a ratio option spread: sell one option at a strike near the money and buy two options of the same type at a strike further out, all within the same expiration. Sell one call and buy two higher-strike calls and you have a call backspread, a position that wants a large rally. Sell one put and buy two lower-strike puts and you have a put backspread, the classic crash structure. The 1x2 ratio is the canonical form; 2x3 and 1x3 variants exist but change nothing structural.
The short leg exists to finance the long legs. When the short option's premium exceeds the combined cost of the two longs, the spread is done for a net credit and can be wrong on direction yet still expire mildly profitable. The price of that financing is a zone of maximum loss centered exactly on the long strike at expiration — traders call it the valley of death. A backspread is a bet that the underlying goes nowhere or goes far; the middle outcome is the one that hurts.
Construction and the Credit Question
Credit or debit depends on how far apart the strikes sit and on what the volatility surface charges for each. Move the long strikes further away and they get cheaper, so the credit grows — but the trough deepens with it, since the maximum expiration loss on a credit call backspread is the distance between strikes minus the credit received. Tighten the spacing and the trough shrinks while the trade slides toward a debit.
Skew settles much of this in advance. Equity-index surfaces price lower strikes at higher implied volatility, an asymmetry that helps the call version — its wings are bought at cheaper implied vol than the option sold, so index call backspreads frequently set up near even money or at a small credit. A put backspread has to buy the most expensively priced region of the surface twice, which is why it so often costs a debit unless the strikes sit close together or expiration is near.
The construction error that loses is stretching the long strikes purely to manufacture a credit: the credit reads as safety, but what was built is a deeper trough and an upper breakeven only an exceptional move reaches.
A Call Backspread in Numbers
Every figure below is hypothetical and quoted in index points; multiply by the point multiplier of the contract you actually trade.
An index future trades at 5,000. You sell one 5,050 call at 60 and buy two 5,100 calls at 28 each, collecting a net credit of 60 - 56 = 4 points. At expiration:
- Below 5,050, every option expires worthless and the 4-point credit is kept.
- At 5,054 the short call is worth 4 and the credit is exhausted — the lower breakeven.
- At 5,100 the short call is 50 points in the money while both long calls expire worthless: a loss of 50 - 4 = 46 points — the maximum, landing precisely on the long strike.
- At 5,146 the short call is worth 96 against two longs worth 46 each, 92 combined: 92 - 96 + 4 = 0. The upper breakeven equals the long strike plus the strike width minus the credit.
- At 5,250 the longs are worth 300 combined against 200 on the short: a gain of 104 points, growing point-for-point with any further rally.
The Valley of Death
The trough earned its nickname less for depth than for how it arrives. With weeks remaining, a mark at 5,100 shows only a small loss because the long calls still carry substantial time value; the valley reaches full depth as expiration closes in. The characteristic failure path is a slow drift toward the long strike while the calendar empties — the loss deepens without price doing anything dramatic.
Near expiry with spot at the long strike, the two longs are at the money — the fastest-decaying spot on the board — while the short has gone almost entirely intrinsic: maximum rent on two contracts just as the one you sold stops paying you.
I run a time rule on these rather than a price stop: if the trade hasn't left the strike zone by the last quarter of its life, it gets closed. The diagram at entry and the diagram of the final week are two different trades.
One more wrinkle: expiration with the underlying near the short strike creates pin risk on an option that may or may not be assigned — closing before the final days sidesteps it.
Greeks: Convexity Now, a Flip Later
While meaningful time value remains, a backspread is net long options: delta at entry is usually a modest lean in the trade's direction (strike selection can push it near neutral), and gamma is positive — the position manufactures delta into a large move, which is the convexity being paid for. Near expiration the sign turns local. Gamma concentrates at whichever strike spot hugs, so a future parked at the short strike leaves the position behaving like a short at-the-money option; at the long strike it is long two.
Vega is the trade's second dependency. With strikes reasonably spaced and time on the clock, two long wings usually out-vega the single closer-in short, making the package net long volatility; push the wings far out of the money, or let expiry approach, and that cushion thins. The exposure cuts hardest after an event passes — an implied-volatility collapse with the underlying unmoved devalues both wings at once, no visit to the trough required. Theta is the mirror image: the structure pays daily for the convexity it holds.
The Put Backspread and the Skew Problem
Same hypothetical future at 5,000. Sell one 4,950 put at 55 and buy two 4,850 puts at 30 each: a net debit of 5 points, the skew premium made visible. At expiration:
- At or above 4,950, all three puts expire worthless and the loss is the 5-point debit.
- At 4,850 the short put is 100 points in the money against two worthless longs: a loss of 105 points, strike width plus debit — the maximum.
- At 4,745 the two longs are worth 105 each, 210 combined, against 205 on the short; after the 5-point debit the trade breaks even. The breakeven equals the long strike minus the width minus the debit.
- At 4,600 the position is worth 500 - 350 - 5 = 145 points, gaining point-for-point below.
The losing scenario is the orderly decline. The market steps down over weeks and settles near 4,850 with volatility contained; the worst point on the diagram is realized in slow motion.
When Volatility Events Fit
A backspread wants the middle of the distribution empty. Two contexts fit that requirement better than the announcement calendar does.
The first is positioning-driven compression. When price is pinned against heavy dealer hedging, ranges tighten until something forces a break, and a move through the gamma flip tends to accelerate rather than stall as hedging flow shifts from damping to chasing. Acceleration is precisely what the structure needs — force enough to carry price through the trough and past the far breakeven. Reading gamma exposure against candidate strikes shows whether the market's mechanics will help or fight the trade; a call backspread with wings just beyond a defended call wall is a bet that a breach turns hedging from resistance into fuel.
The second is the mispriced tail. Implied volatility is normally bid before scheduled events, so a backspread assembled at event prices needs the outcome to beat what the surface already charges — it pays when the surface underestimates the tail, and often it does not. Entering because an event exists, rather than because the tail looks cheap, is how a trader ends up holding two crushed wings the morning after: the move was ordinary and the loss came from the vol.
Exits and the Clock
Management is mostly calendar discipline. The trough is a late-life phenomenon, so a time stop — closing when the position hasn't escaped the strike zone by some set fraction of its life — removes the worst region of the trade for a scratch or a small loss. After a favorable move, buying back the short leg leaves two long options, capping remaining risk at their value with the convex side open. What loses here is drift: holding a stalled backspread into the final week because the diagram once looked good is choosing to sit in the trough while it finishes forming.
Structurally every backspread is the same exchange: sell the middle of the distribution, buy its tail. The premium arithmetic at entry decides whether that exchange was cheap. The calendar decides whether you are still holding when the middle becomes the most expensive place on the curve to be.