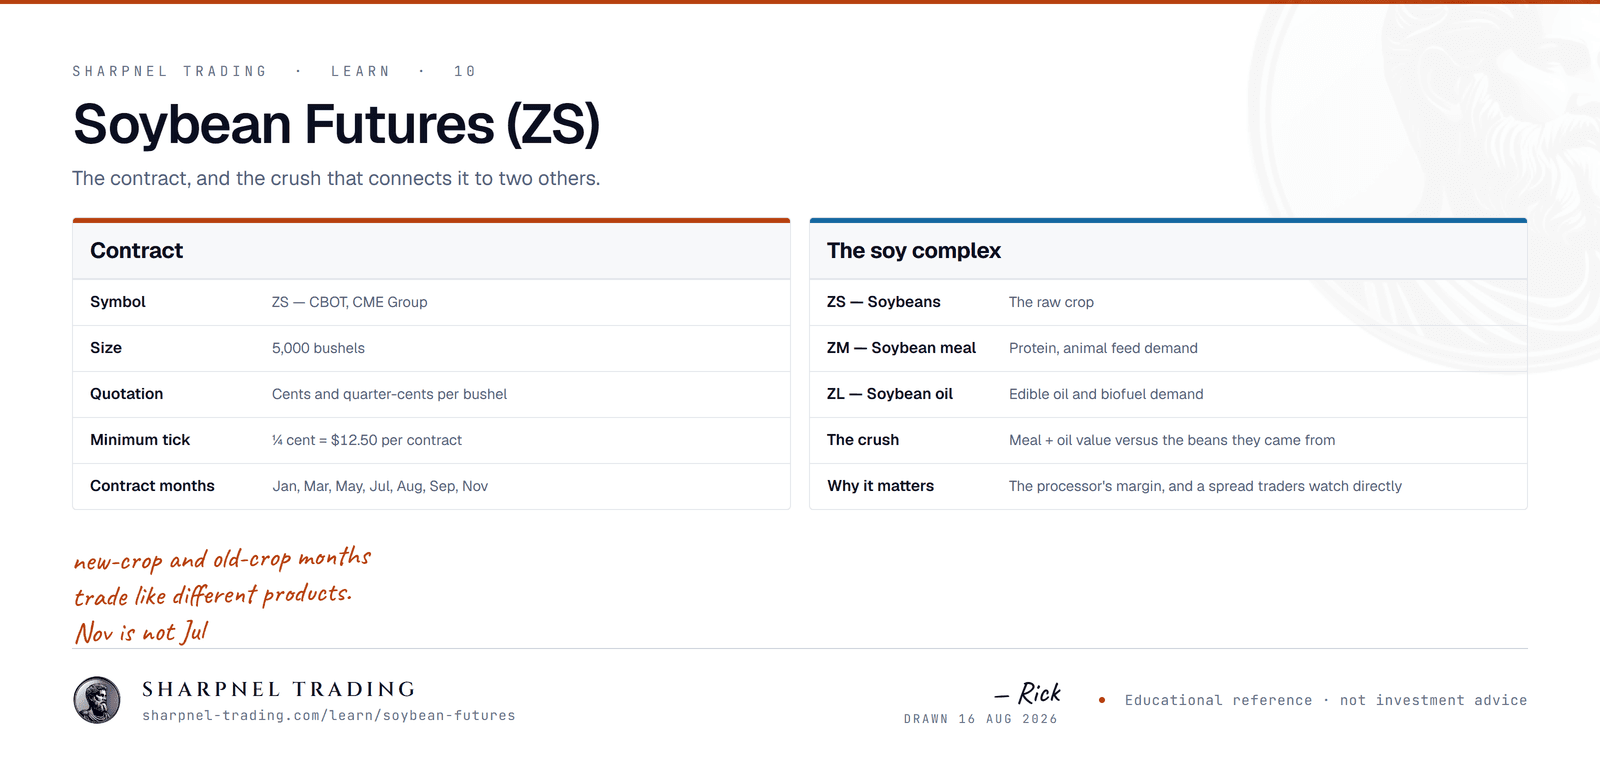
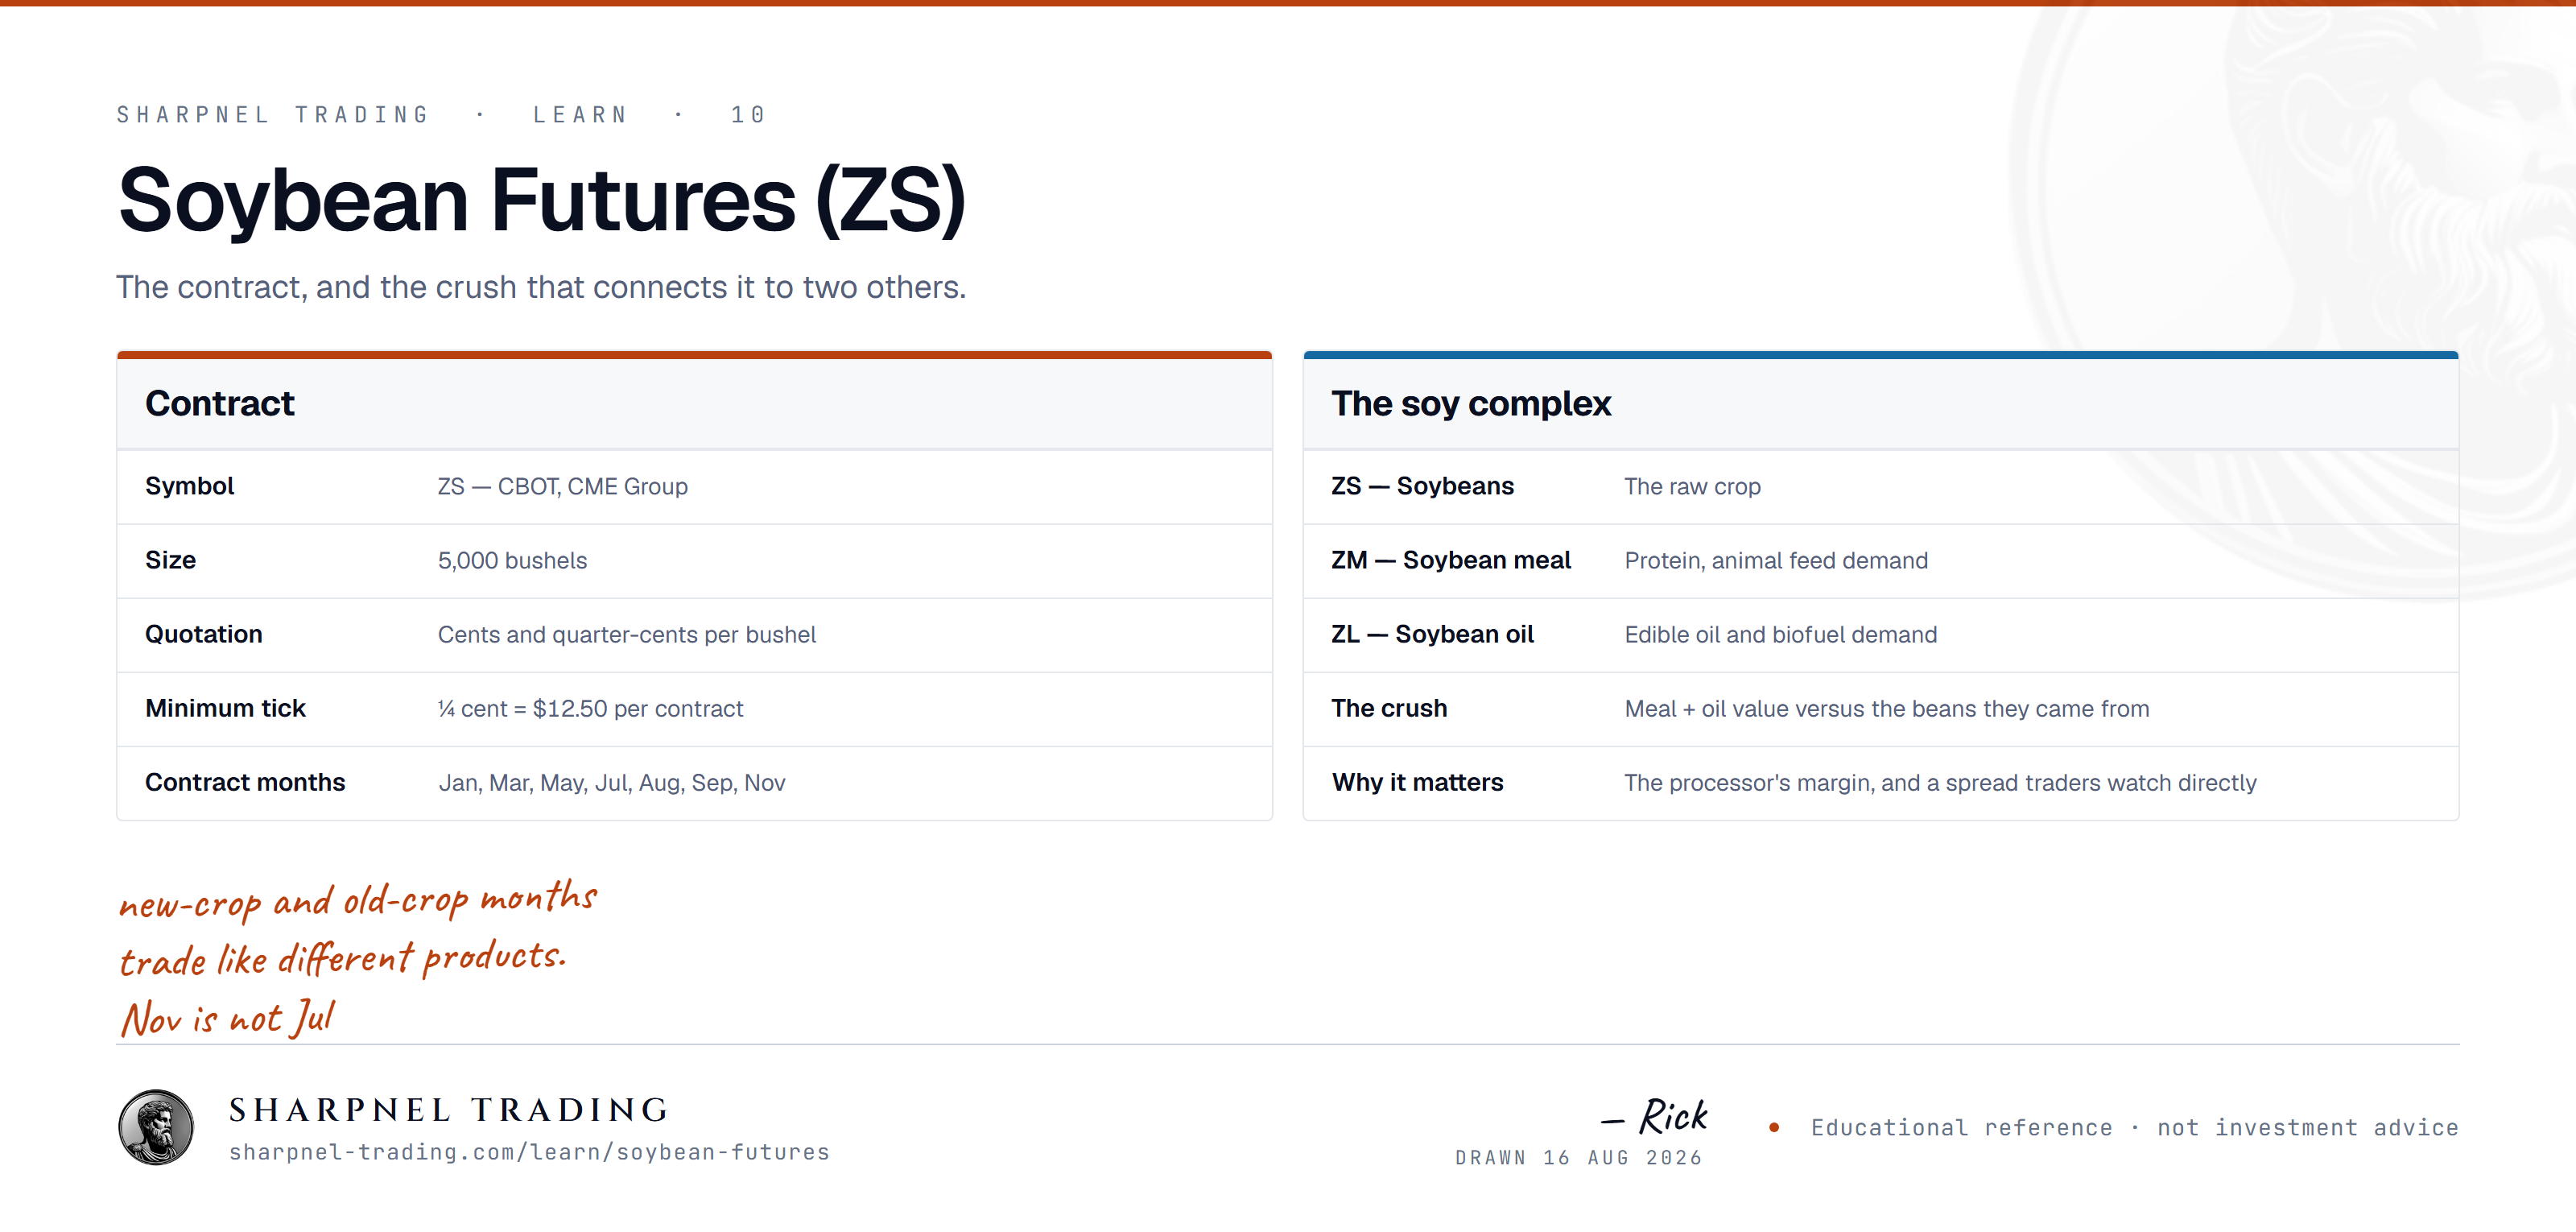
How the crush chains beans to meal and oil
Crushing a 60-pound bushel of soybeans yields roughly 44 pounds of meal and about 11 pounds of oil. Meal trades in dollars per short ton and oil in cents per pound, so the board crush converts everything into dollars per bushel:
Board crush ($/bu) = (ZM price × 0.022) + (ZL price × 0.11) − ZS price
The 0.022 is 44 lbs divided by a 2,000-lb ton; the 0.11 turns 11 lbs of oil priced in cents per pound into dollars per bushel.
A worked example with deliberately invented prices: meal at $300 per ton contributes $6.60, oil at 45 cents per pound contributes $4.95, for a combined product value of $11.55 per bushel. Against beans at $10.50, the gross board crush is $1.05. That margin — not any single leg — is what a processor defends, and it is what keeps the three markets from drifting apart indefinitely.
Traders express the margin directly. Long the crush means long meal and long oil against short beans, profiting if margins widen; the reverse crush is the mirror image. A bushel-balanced version runs close to 10 bean contracts against 11 meal and 9 oil, though plenty of traders run it 1:1:1 for simplicity. The losing side deserves equal print: a long crush bleeds when beans rally on export demand while product demand stalls, and a three-legged position pays three commissions plus three bid/ask crossings, so the margin has to move further than the round-trip friction before anything is earned. Exchange margin credits on the spread reduce the capital tied up; they do nothing to limit how far the spread itself can run against you.
Two harvests a year: the U.S. against South America
The United States plants from late April into June and harvests September through November, with the August pod-setting window as the weather market in between. Brazil — now the world's largest producer and exporter — plants from September into December and harvests from January into May. Argentina, which crushes most of its own crop and dominates world exports of meal and oil, harvests mostly from March into June.
The practical consequence is a major harvest arriving somewhere roughly every six months, with export demand migrating toward whichever origin just refilled. U.S. export loadings dominate from September into January; once Brazil's new crop reaches its ports around February, origin demand shifts south and U.S. old-crop premiums have to be earned by something other than availability.
That cycle is why the July/November relationship draws so much attention. July prices the tail of the previous U.S. harvest; November prices a crop that may still be seed in a bag. Tight old-crop stocks can invert the spread — July trading over November — while comfortable stocks leave a carry reflecting storage economics. Treat the seasonal patterns built on all of this (harvest-pressure lows, summer weather premiums) as averages across very different years. The years that break them — a demand shock, or a record South American crop landing on a long market — are exactly the years the "reliable" pattern invited size, which is how seasonal traders give back several years of small wins in one bad one. Any seasonal statistic quoted without the dispersion around it is marketing.
WASDE and the report calendar
The USDA's World Agricultural Supply and Demand Estimates lands monthly at noon Eastern. For soybeans the market keys on U.S. ending stocks and the stocks-to-use ratio, plus the USDA's running estimates of Brazilian and Argentine production during their growing seasons. Around WASDE sit the other fixtures: Prospective Plantings in late March, Acreage at the end of June, quarterly Grain Stocks, weekly Export Sales on Thursday mornings, weekly Crop Progress on Monday afternoons through the U.S. season. Export Sales punches above its weight because Chinese demand — well over half of world soybean import buying — often shows up there first, sometimes filed under "unknown destinations."
Report days are their own risk regime. A genuine surprise prints as an instantaneous gap; there is no working into the position when ending stocks miss badly, and a large enough miss pins the market at its daily limit, where the losing side cannot exit at any price until limits expand. Holding through the release is a position in the report itself, whether intended or not. Options are not automatically the safer route: implied volatility inflates into report dates, so a straddle bought the day before loses on the volatility reset as well as the decay whenever the number lands inside expectations — which is the modal outcome.
After the print, the tape usually says more than the number. Whether cumulative delta confirms the direction of the gap, and whether price builds acceptance in a new value area or rotates straight back into the old one, reveals positioning that the headline stocks figure cannot.
Founder note: the first WASDE I sat through after years on equity indexes re-taught me the dollar math. A 30-cent gap is $1,500 per contract before the market trades a single tick you could react to. Grain report risk is measured in gaps, not stops.
Smaller sizes: mini and micro soybeans
Two smaller contracts track the same market:
- Mini soybeans (XK): 1,000 bushels, one-fifth of ZS. Each cent is $10 and the tick is one-eighth of a cent, $1.25. Minis are physically delivered like the full-size contract, so the first-notice discipline still applies.
- Micro soybeans: 500 bushels, one-tenth of ZS, listed in 2025. Each cent is $5. Micros settle financially against the standard contract rather than through delivery, which removes the delivery mechanics but not the need to roll.
The trade-off is liquidity. The full-size book carries the resting size; the smaller contracts track it through arbitrage but quote wider in fast conditions. A method that crosses the spread frequently gives up a larger fraction of each cent in the smaller contracts, so the honest use case is sizing risk down — $5-per-cent exposure while learning the report calendar — rather than rapid-fire execution in a thinner book. Reading the
depth of market in the full-size contract stays the better guide to where real size sits, whichever contract the order actually goes to.
The numbers that do the work
Sizing in soybeans starts from the cent, not the tick. A trader risking $500 on one full-size contract is risking a 10-cent move — routinely inside a single day's range, and always inside a report gap. Backing into size from dollar risk is the entire reason the smaller contracts exist: the same 10 cents is $50 on a micro. Before any thesis about crush margins or South American weather, the arithmetic has to hold, because the market grades nothing else. It multiplies bushels by cents, every day, without comment.