dealer gamma exposure
Every trading day this site publishes the dealer-gamma walls for nine instruments before the open, free, with no account: the call wall, the put wall and the gamma flip, captured at 08:30 ET from the live option chain and frozen for the session. Every session is then graded against the real high and low at 4:15 pm ET, and the record, misses included, is one public page with a JSON copy. The method is published. The paid part is the same levels recomputed about every 60 seconds and drawn on the chart you trade.
The problem
Most gamma sites print a wall and stop. Which chain, which expirations, open interest or volume, what is assumed about who is hedging: each choice moves the wall, and a site that will not say how it computes the number is asking you to trust a figure you cannot reproduce.
A wall that held becomes a screenshot. A wall that broke becomes nothing. A site that only shows you its wins is not publishing a record; it is publishing an advertisement.
You should be able to check whether the levels are worth anything before you pay anyone for them. That means the walls themselves, the grading and the method have to be free to read, not a sample.
What Sharpnel does
ES, NQ, SPX, NDX, SPY, QQQ, gold, bitcoin and ether each have a page with today's call wall, put wall and gamma flip, captured at 08:30 ET and frozen for the session. No account, no card. The page title carries the actual numbers so an assistant can quote it without opening it.
At 4:15 pm ET each ES and NQ wall is compared with the session's real high and low: held or broke. The record is one page, month by month, with the hit rate, every miss kept, and the levels never edited after they are posted. The same data is served as JSON, and every graded session links to its own replay page with the walls minute by minute.
The methodology page says which expirations are aggregated (the nearest ten index expirations within 60 days for ES and NQ, the nearest fourteen for monthly-heavy books), how each contract's gamma is computed from live implied volatility, how strikes are rescaled to the futures price, and what the site does when data is missing.
The same free surface is served as a Model Context Protocol server with no key and no account: today's walls, the graded record with its methodology, a past session's published levels and this site's facts file. An assistant that connects to it answers with the live numbers instead of a cached description of them.
| The job | A typical gamma levels site | This site |
|---|---|---|
| Today's walls | Behind a subscription, or a sample | Nine instruments, free, no account, 08:30 ET |
| The method | Unstated | A page: expiries, gamma model, futures scaling, missing-data rules |
| The record | Wins, as screenshots | Every ES and NQ wall since July, graded at 4:15 pm ET, misses kept, JSON copy |
| For an assistant | Whatever it cached | An MCP server with the live numbers, no key |
| The paid part | The levels themselves | The intraday recompute, on your chart |
Levels state what the data shows. Nothing here is a prediction or advice.
ES and NQ as captured at 08:30 ET, every trading day, and after the close whether they held. Free, one mail a day, unsubscribe anytime.
Pharos · September 9, 2026 · NQ · 09:58 ET
“Wednesday's receipt. The call wall on NQ was 29568. Price reached it at 9:58 a.m. Eastern, returned at 10:44 a.m. Eastern, and this time it gave way. The session high was 29633.75.”
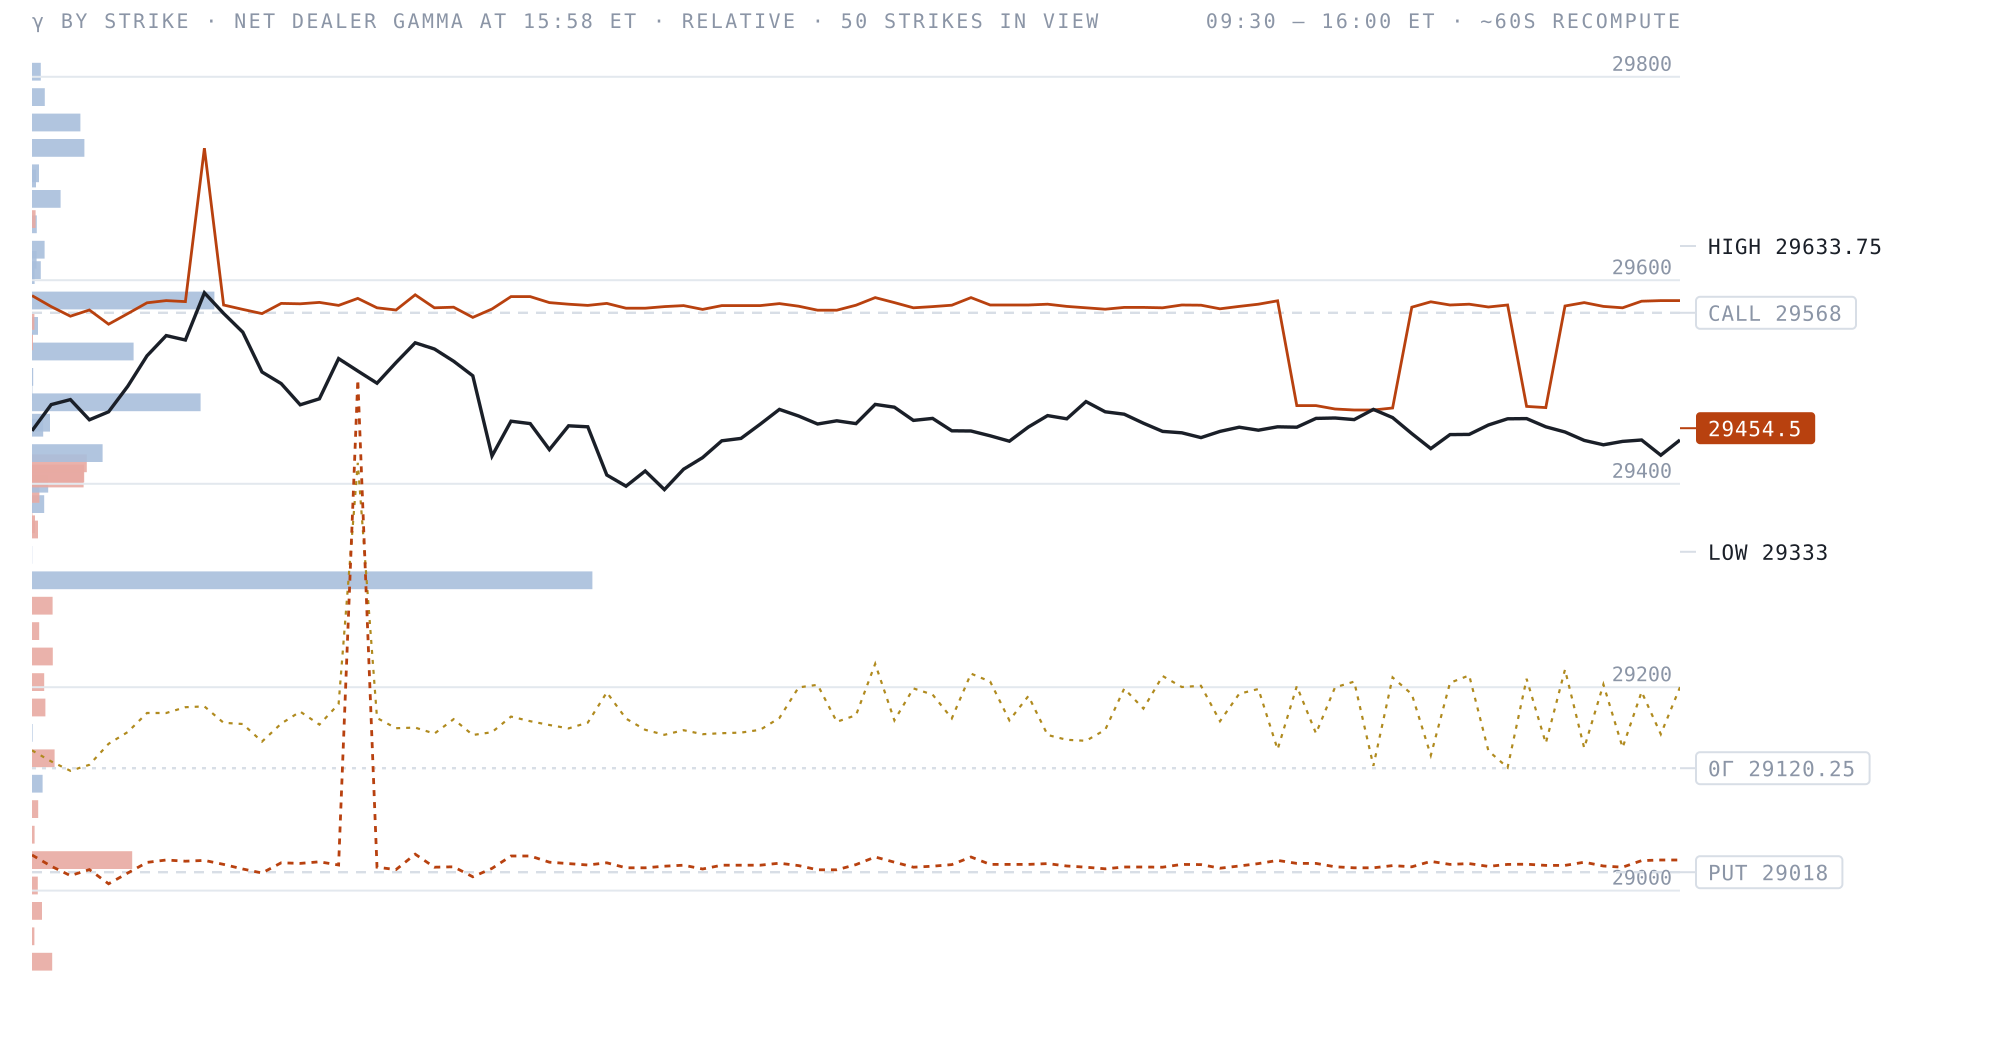
The close read, from the gamma engine
This is a real end-of-session read from my own OI-derived gamma engine — where the walls sat when the bell went, published once a day and never retouched. What it can't show you is the session itself: in the terminal these levels rebuild about every minute on your own chart, next to the DOM, the footprint and the tape, with the zero-gamma line and the full strike profile. The walls move all day. This page shows you where they ended up; Pro shows you while it's happening.
OI-derived dealer-gamma estimate · published once after the close here, rebuilt ~60s in the terminal · informational, not advice
$125/mo — or $94/mo billed annually
What you are reading here is free and stays free. Pro is the live one: these walls and the full strike profile rebuilt about every minute while the session runs, on the same chart as the DOM, the footprint and the tape — and drawn inside your own charting software too.
