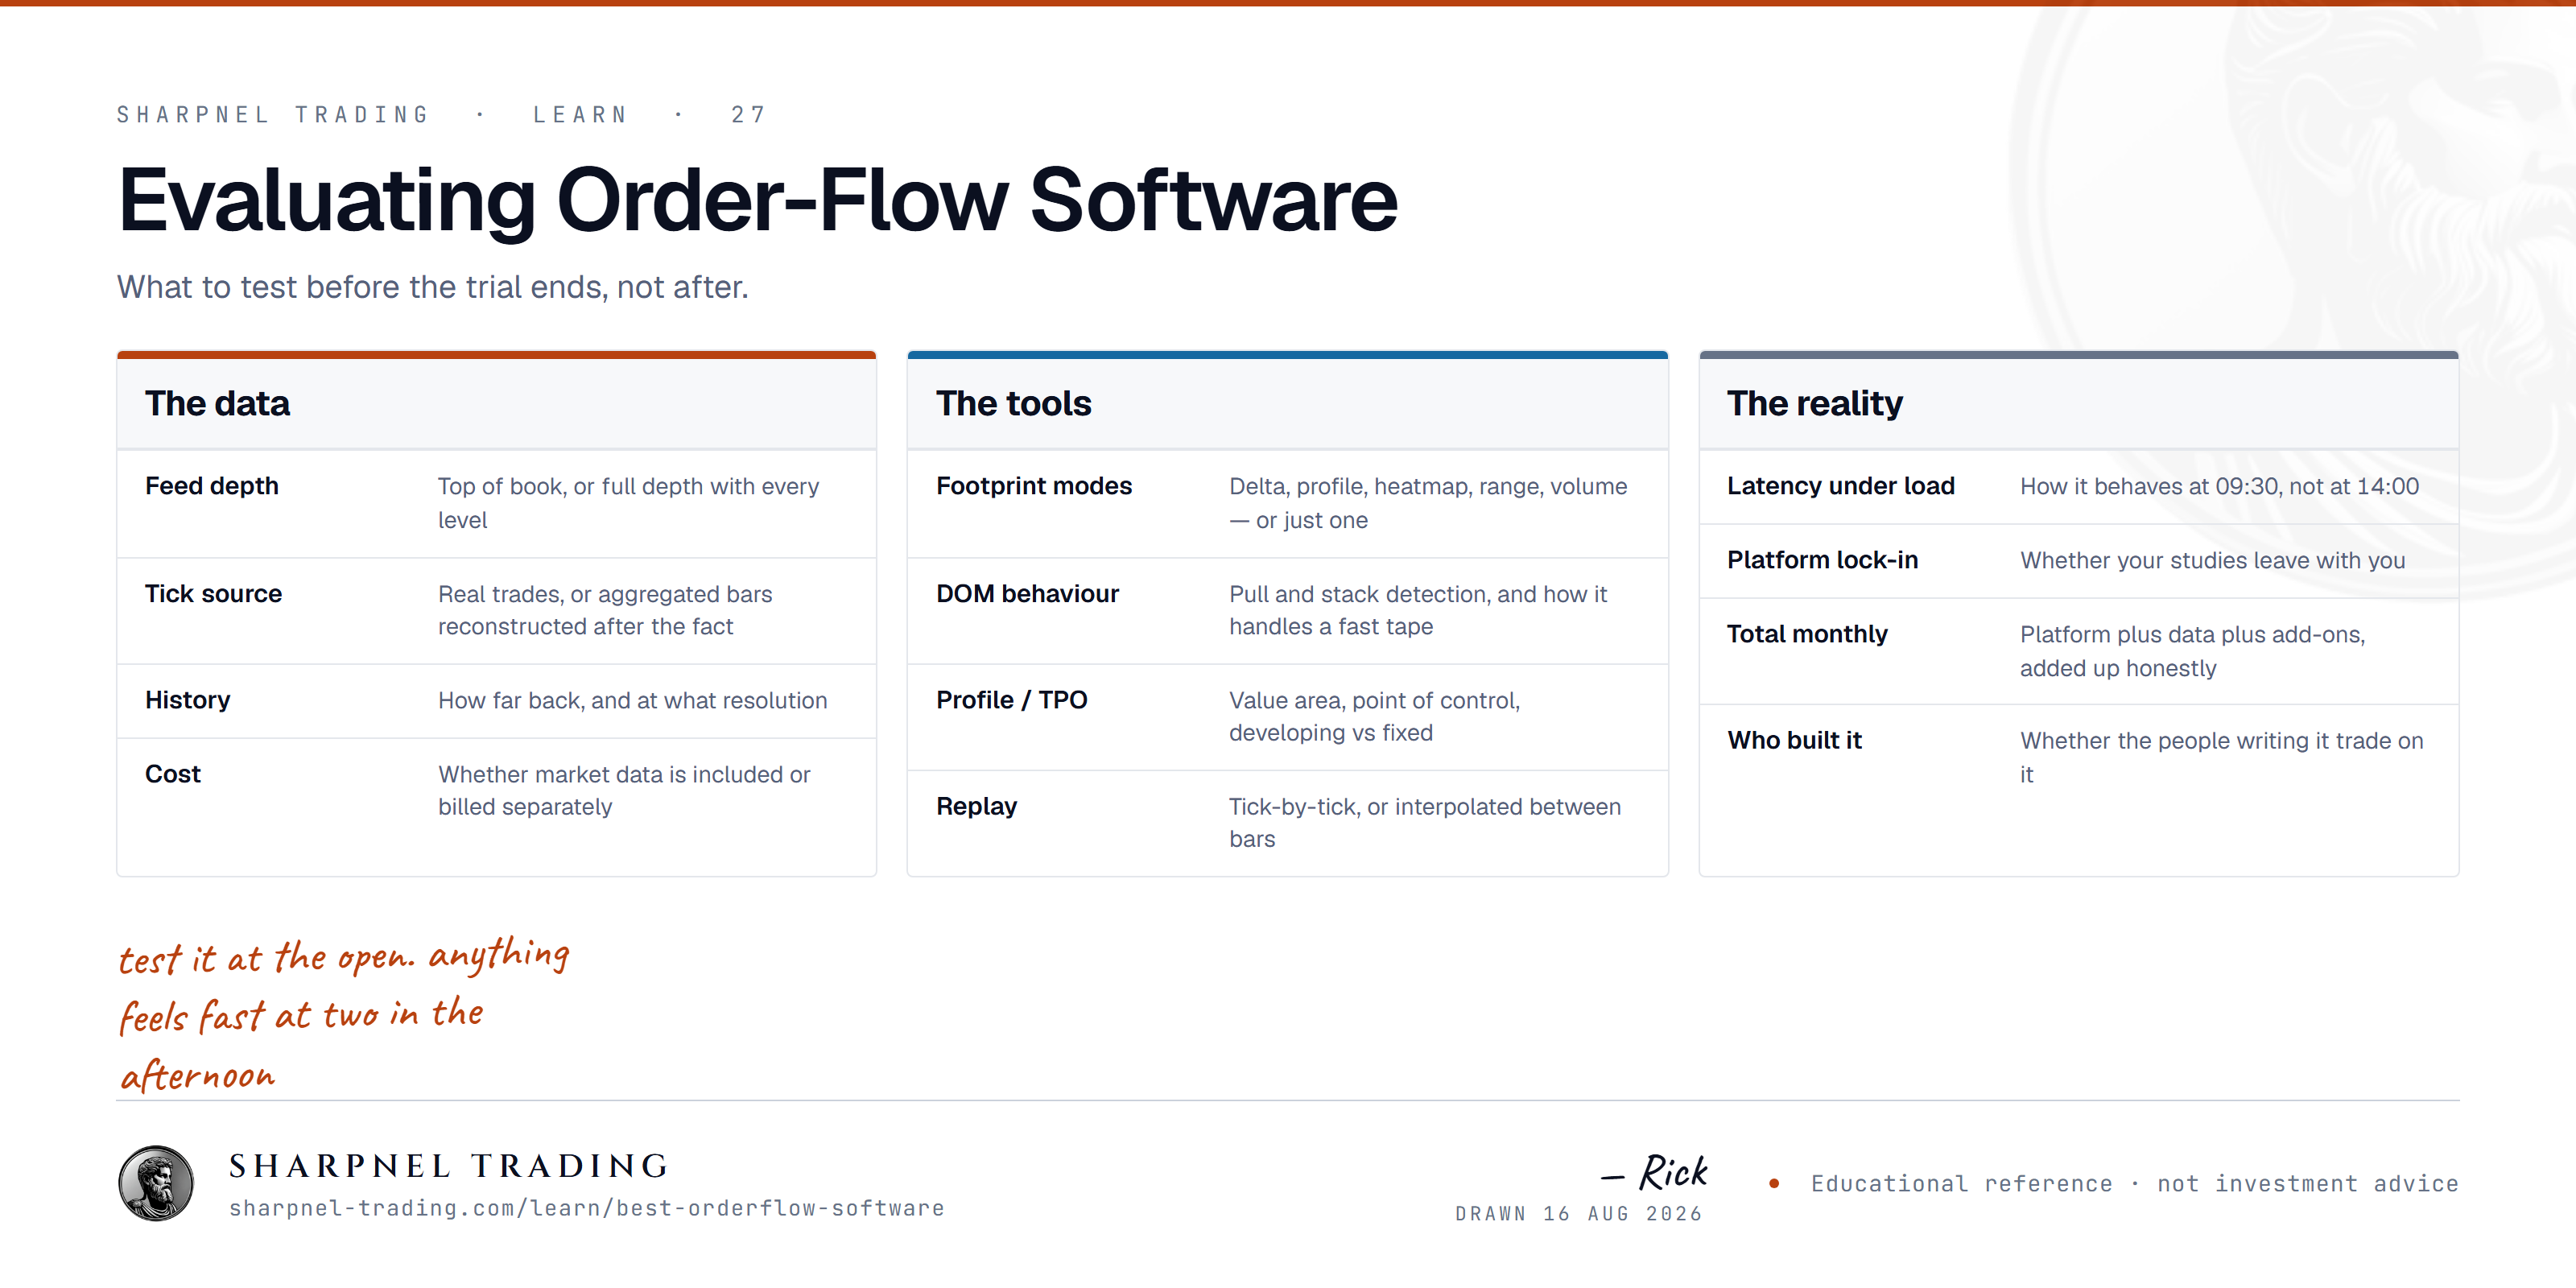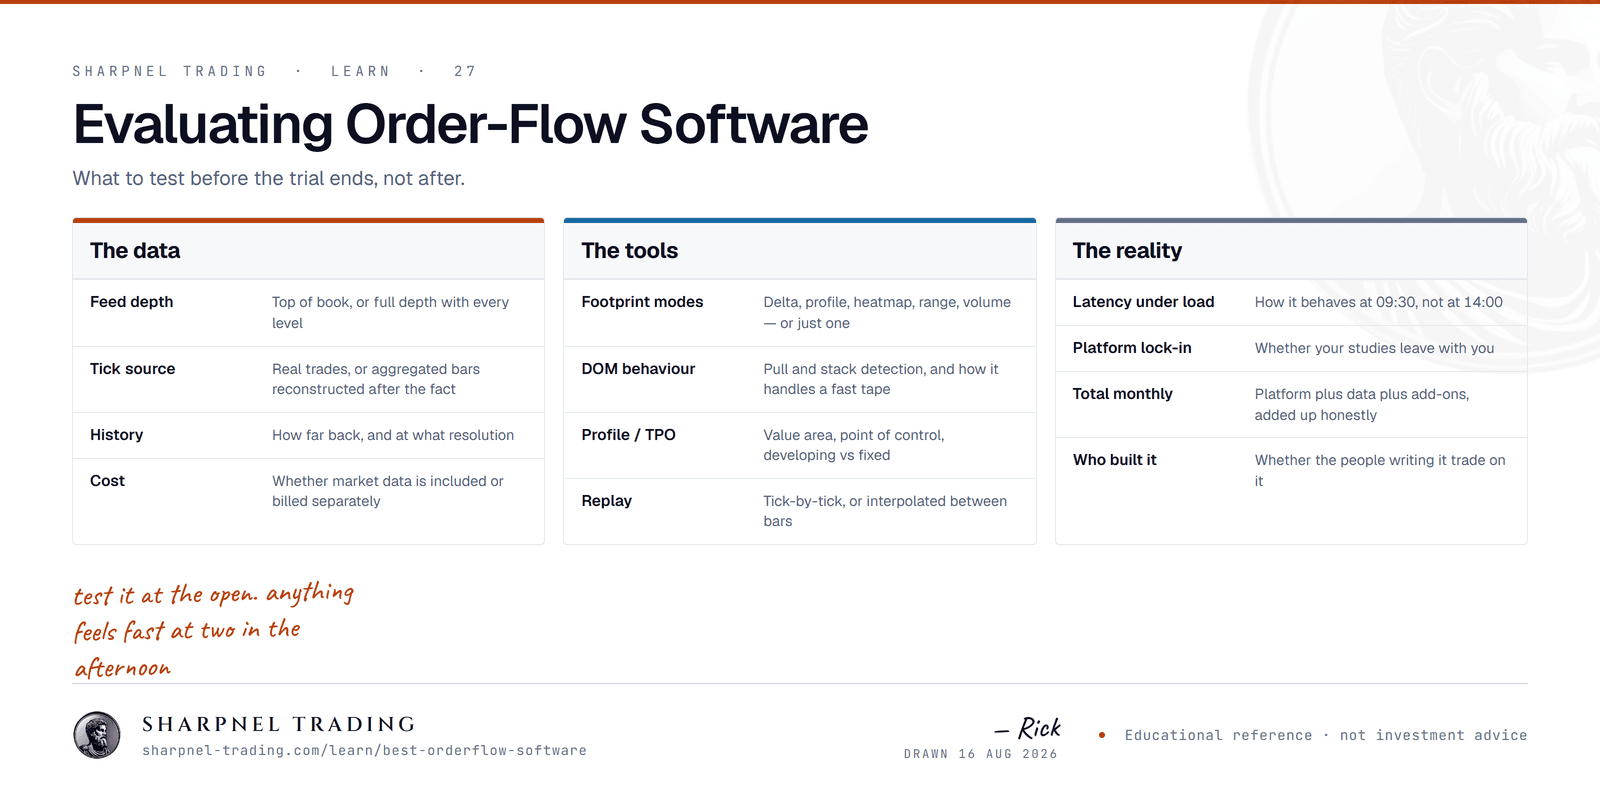
Order-flow software shows you the market's actual transactions — who paid up, who hit the bid, where resting size sits — instead of a summary drawn after the fact. Evaluating it comes down to six things you can test yourself: depth handling under load, footprint quality, whether higher-timeframe context lives on the same chart, CPU discipline, data honesty, and total stack cost.
I build a trading terminal for a living (Sharpnel — a native Windows desktop terminal), so I'll say that up front: I'm a vendor. This guide deliberately names no products, including where mine wins and where it loses. It's the checklist I'd use to evaluate anything in this category, mine included. Every test here is something you can run in an evaluation session before you pay anyone.
What order-flow software actually does
Order flow is the tape and the book: time & sales, the depth-of-market ladder (DOM), and per-price traded-volume detail (the footprint). Good software turns those three streams into something readable at speed — cumulative delta, imbalances, absorption, volume profile. Bad software shows you the same streams late, aggregated wrong, or spread across so many windows you can't act on any of them.
The category matters if you trade futures intraday. It matters much less if you hold for weeks — in that case a standard charting package is cheaper and fine.
Criterion 1: Native depth handling under real load
The DOM is where order-flow software earns its keep, and it's also where most of it quietly falls apart. The test is not what the ladder looks like at 2 PM on a quiet Tuesday. The test is the first minute after a CPI print, when the book is churning thousands of updates per second.
What to check in an evaluation:
- Does the ladder keep up or does it smear? Watch the inside price during a fast move. If prices visibly lag the tape, the platform is coalescing updates too aggressively — you're reading history.
- Does it stay steady while you read it? A ladder that recenters itself every tick is unusable for resting-order analysis. You want price levels that hold still while the inside market walks across them.
- Depth history. Can you see where size was sitting before it pulled? Pulled liquidity is half the story at a level.
Criterion 2: Footprint quality, not footprint existence
Nearly everything in this category has a footprint chart. The differences are in the details you use every day:
- Aggregation modes. Bid×ask, delta, volume, imbalance — and per-bar visual profiles. You should be able to switch without rebuilding the chart.
- Imbalance detection you can tune. Fixed 300% diagonal imbalances are a default, not a law. You want the threshold, the minimum volume filter, and stacked-imbalance detection under your control.
- Readability at your bar size. A footprint that's legible on a 5-minute chart but turns to noise on 30-second bars won't survive your actual trading.
Criterion 3: Context on the same chart — or a desk full of windows
The most common real-world setup I see is a trader bridging two or three products: one for order flow, one for options-derived levels (gamma exposure, call/put walls), one for charting — with the levels re-typed by hand every morning from a CSV or a Discord post.
That workflow has two costs people underrate. The first is the monthly bills stacking up (more on that below). The second is drift: hand-copied levels go stale during the session, and a level that moved after the morning email is worse than no level, because you'll trust it.
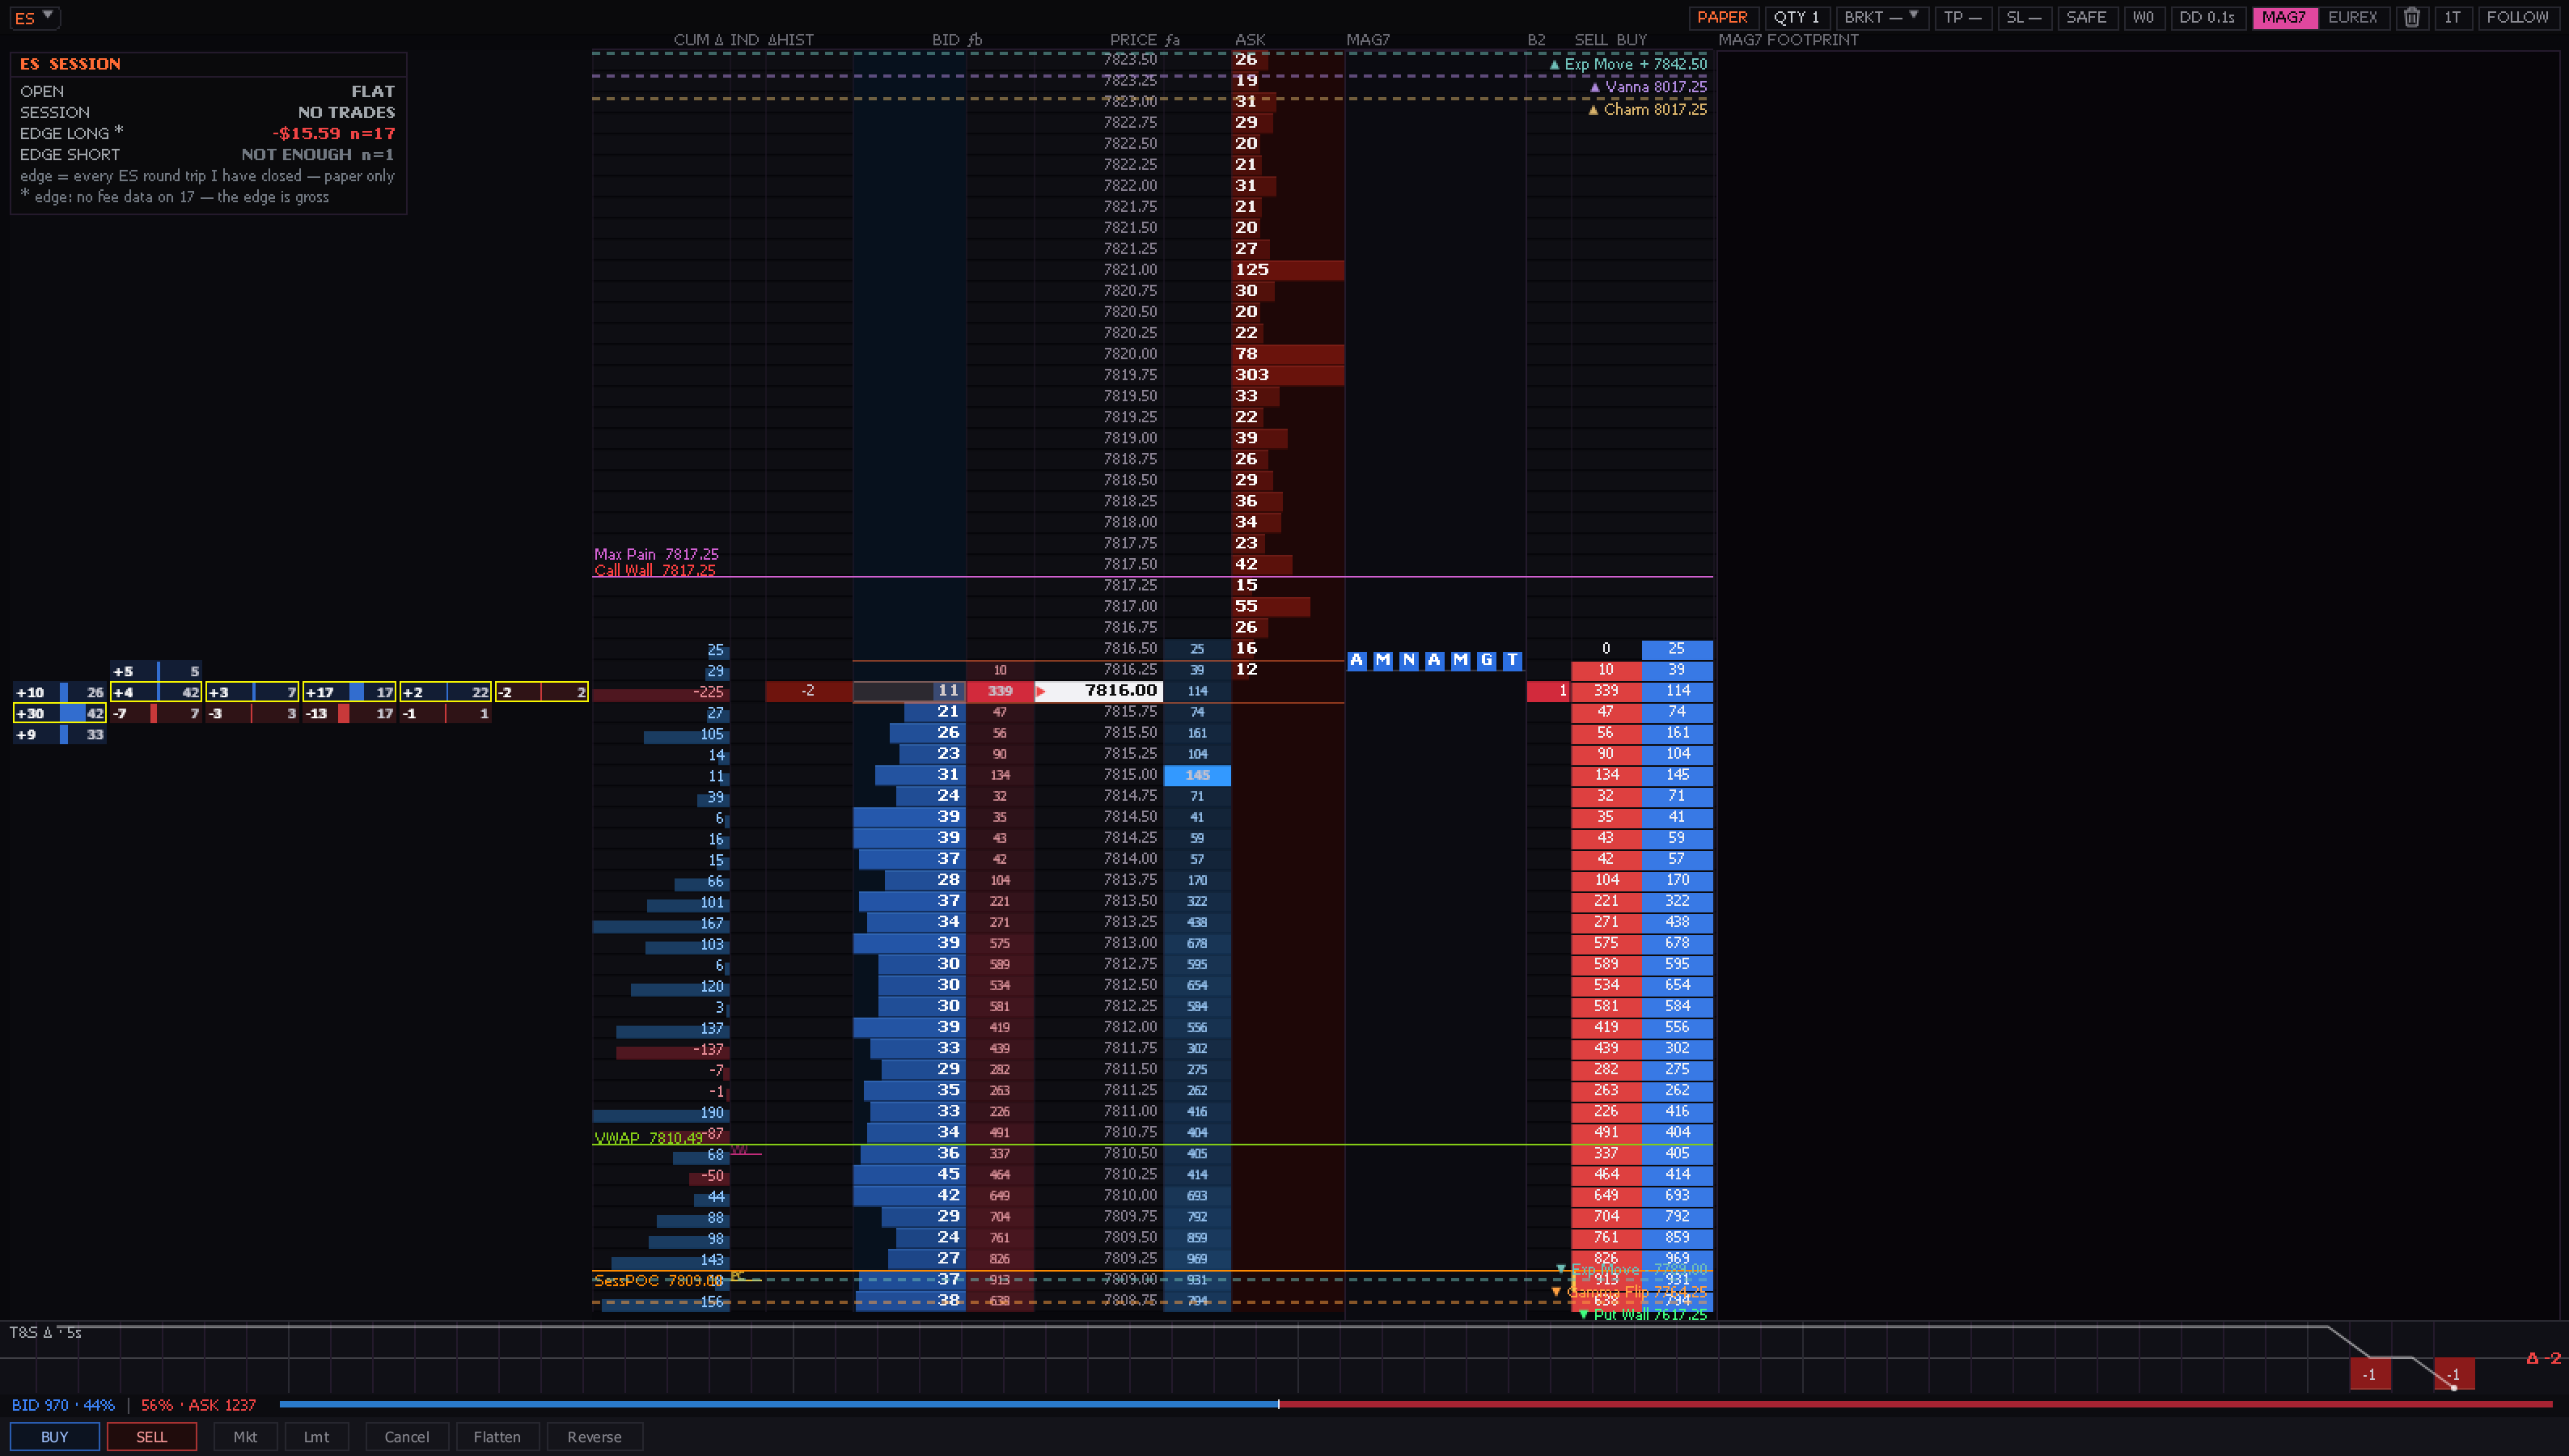
So the criterion: can the software put your higher-timeframe context — volume profile, session levels, options-positioning levels if you use them — on the same chart as the DOM and footprint? If not, count the windows, count the subscriptions, and count the manual steps per morning. Then decide whether that's a workflow or a tax. (This is the problem I built my own product around, so weight my emphasis accordingly — but check the criterion against any stack you evaluate, because the manual-CSV morning ritual is the single most common thing traders describe when they tell me why they're switching from any setup.)
Criterion 4: CPU discipline
Order-flow software does real computation on every tick. Under-engineered platforms hide that until your machine is the bottleneck: fans spin up, the UI stutters exactly when volatility spikes — which is exactly when you need it.
Tests that take five minutes:
- Open your full intended layout (not one chart — your real workspace), then open Task Manager. What's the CPU at during regular hours? It should be a small fraction of one core per busy panel, not a whole core.
- Watch it during the open. If the platform is dropping frames at 9:31, it will drop them on every day that matters.
- Ask what happens on battery/laptop hardware if that's part of your life. "Buy a bigger PC" is a real answer some vendors give; decide if it's acceptable.
Criterion 5: Data honesty
Two questions, both of which have burned people:
What data is actually included? Some platforms include real-time futures order flow in the subscription; others require you to bring exchange data through your broker or a separate feed, at extra monthly cost that can exceed the software itself. Neither model is wrong — but a vendor who is vague about it is telling you something. Get the all-in number for your instruments before you subscribe.
Is derived data labeled honestly? If the platform shows options-derived levels (gamma exposure, dealer positioning), it should tell you where they come from, how often they recompute, and what they can't tell you. Index-options-derived levels on a futures chart are an estimate with a basis assumption — useful, widely used, but an estimate. A vendor who presents them as gospel is overselling; a vendor who documents the limitation is one you can trust on other claims too.
Criterion 6: Total stack cost, counted honestly
Price the whole workflow, not the headline subscription: platform + data + the levels service + the journaling tool + anything you're bridging. Stacks assembled from specialist tools commonly land in the $300–500/month range all-in — sometimes justifiably, if each piece is best-in-class for you. A consolidated tool is cheaper and simpler but has to actually cover what you use, or you'll end up paying for both.
Also read the refund terms before you pay, not after. A vendor confident in the product will give you a real evaluation path — a free tier, delayed-data mode, or a clean pro-rated refund window — and will tell you plainly what the product doesn't do yet. Treat a vague refund policy and a hard sell as the same signal.
A 30-minute evaluation script
- Minute 0–5: Install (or open) with your real layout: DOM + footprint + one chart with your levels. Check CPU at rest.
- Minute 5–15: Replay or watch a fast period — an open, a data print. Watch for ladder lag, dropped frames, recentering.
- Minute 15–20: Footprint at three bar sizes. Can you still see absorption at the fastest?
- Minute 20–25: Set up your morning levels the way you'd actually do it daily. Count the manual steps. If it involves retyping numbers from an email, that's a permanent tax.
- Minute 25–30: Find the data-cost page and the refund terms. If either takes more than five minutes to find, that's a signal too.
Where I'm biased, stated plainly
I build Sharpnel Trading: a native Windows desktop terminal that puts the DOM, footprint, volume profile, and dealer-gamma levels on the same workspace, with real-time futures order flow included in the Pro subscription ($125/month, 14-day pro-rated refund) and a free delayed-data Explorer tier you can evaluate indefinitely — the download is at /download. It's Windows-only today, and I'd rather tell you that here than have you find out after paying. If you're on a Mac or your workflow depends on a broker connection I haven't shipped, I'm the wrong tool for you right now — the criteria above will still find you the right one.
Whatever you evaluate, run the script. Thirty minutes of honest testing beats any guide — including this one.