The stock research desk
Pick stocks on first launch and the terminal opens this desk: the chart, the financials, the Street's view, who owns it, what insiders are doing, and the latest filings — every panel following the same symbol. No DOM ladder anywhere until you ask for one.
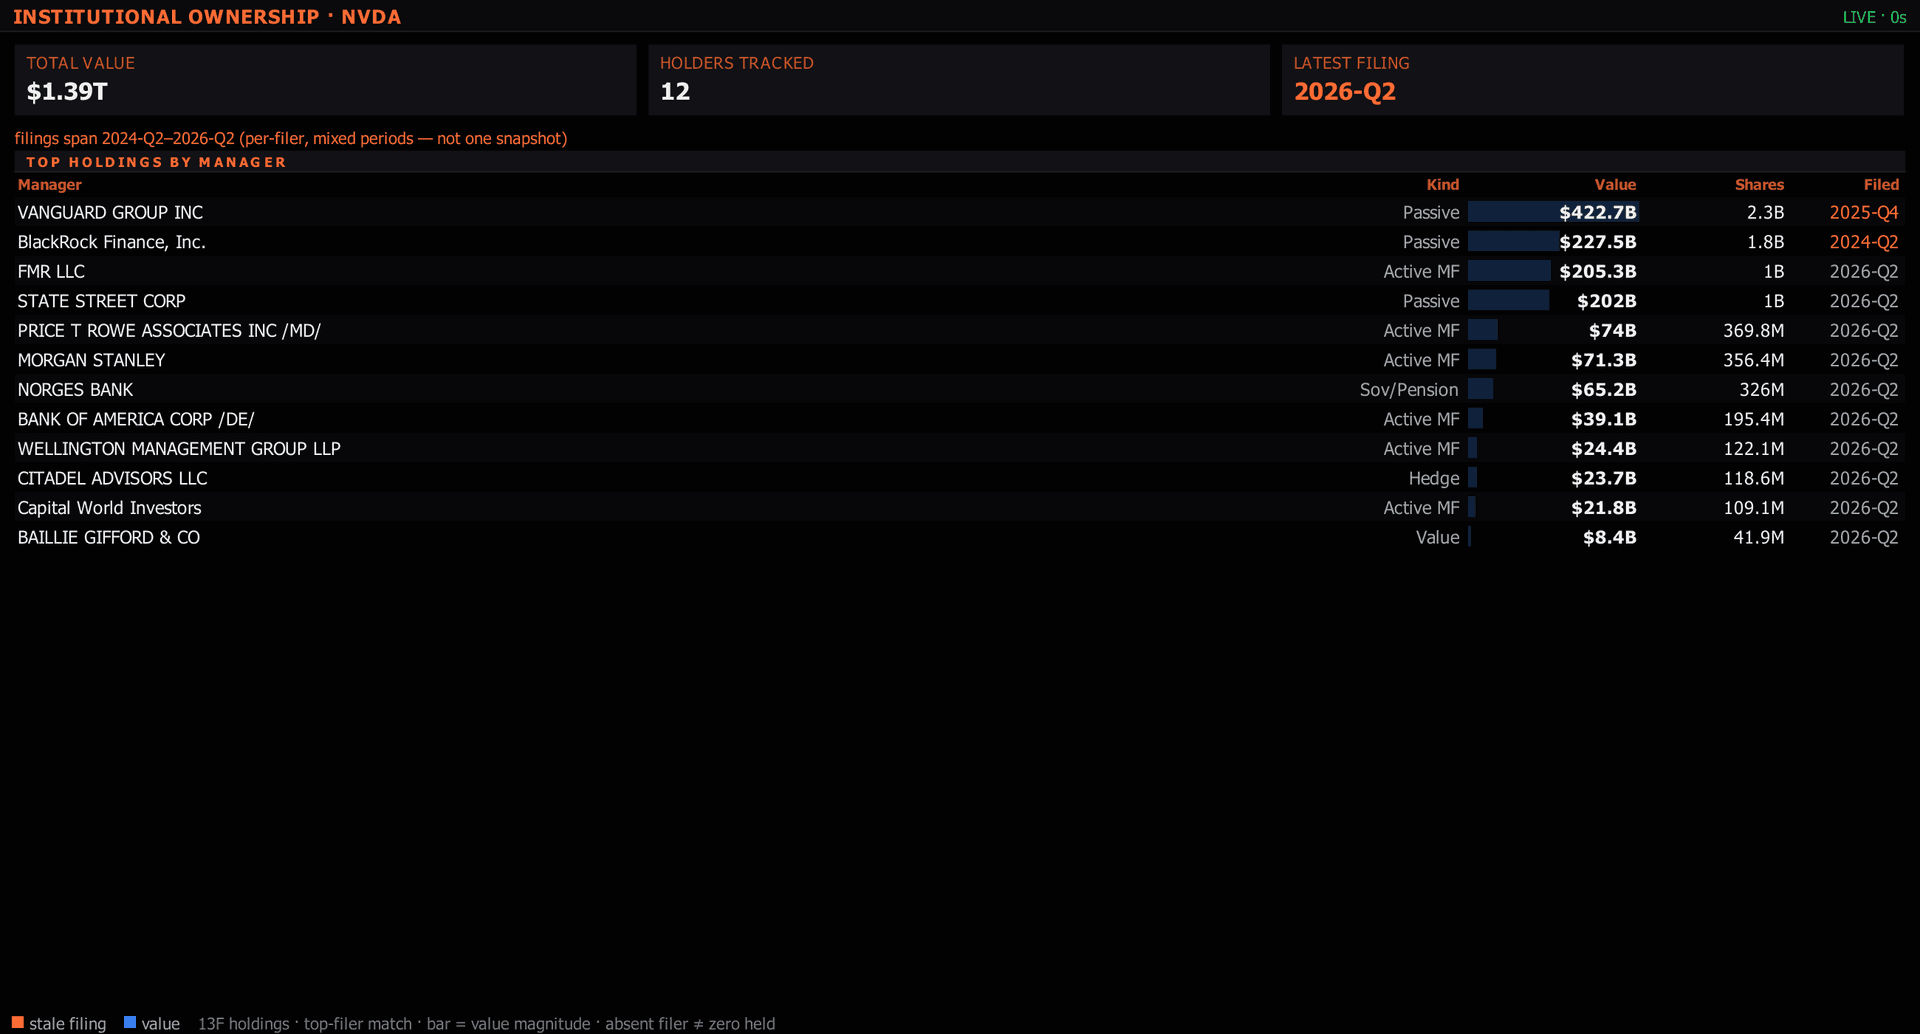
13F ownership · the actual panel, live data
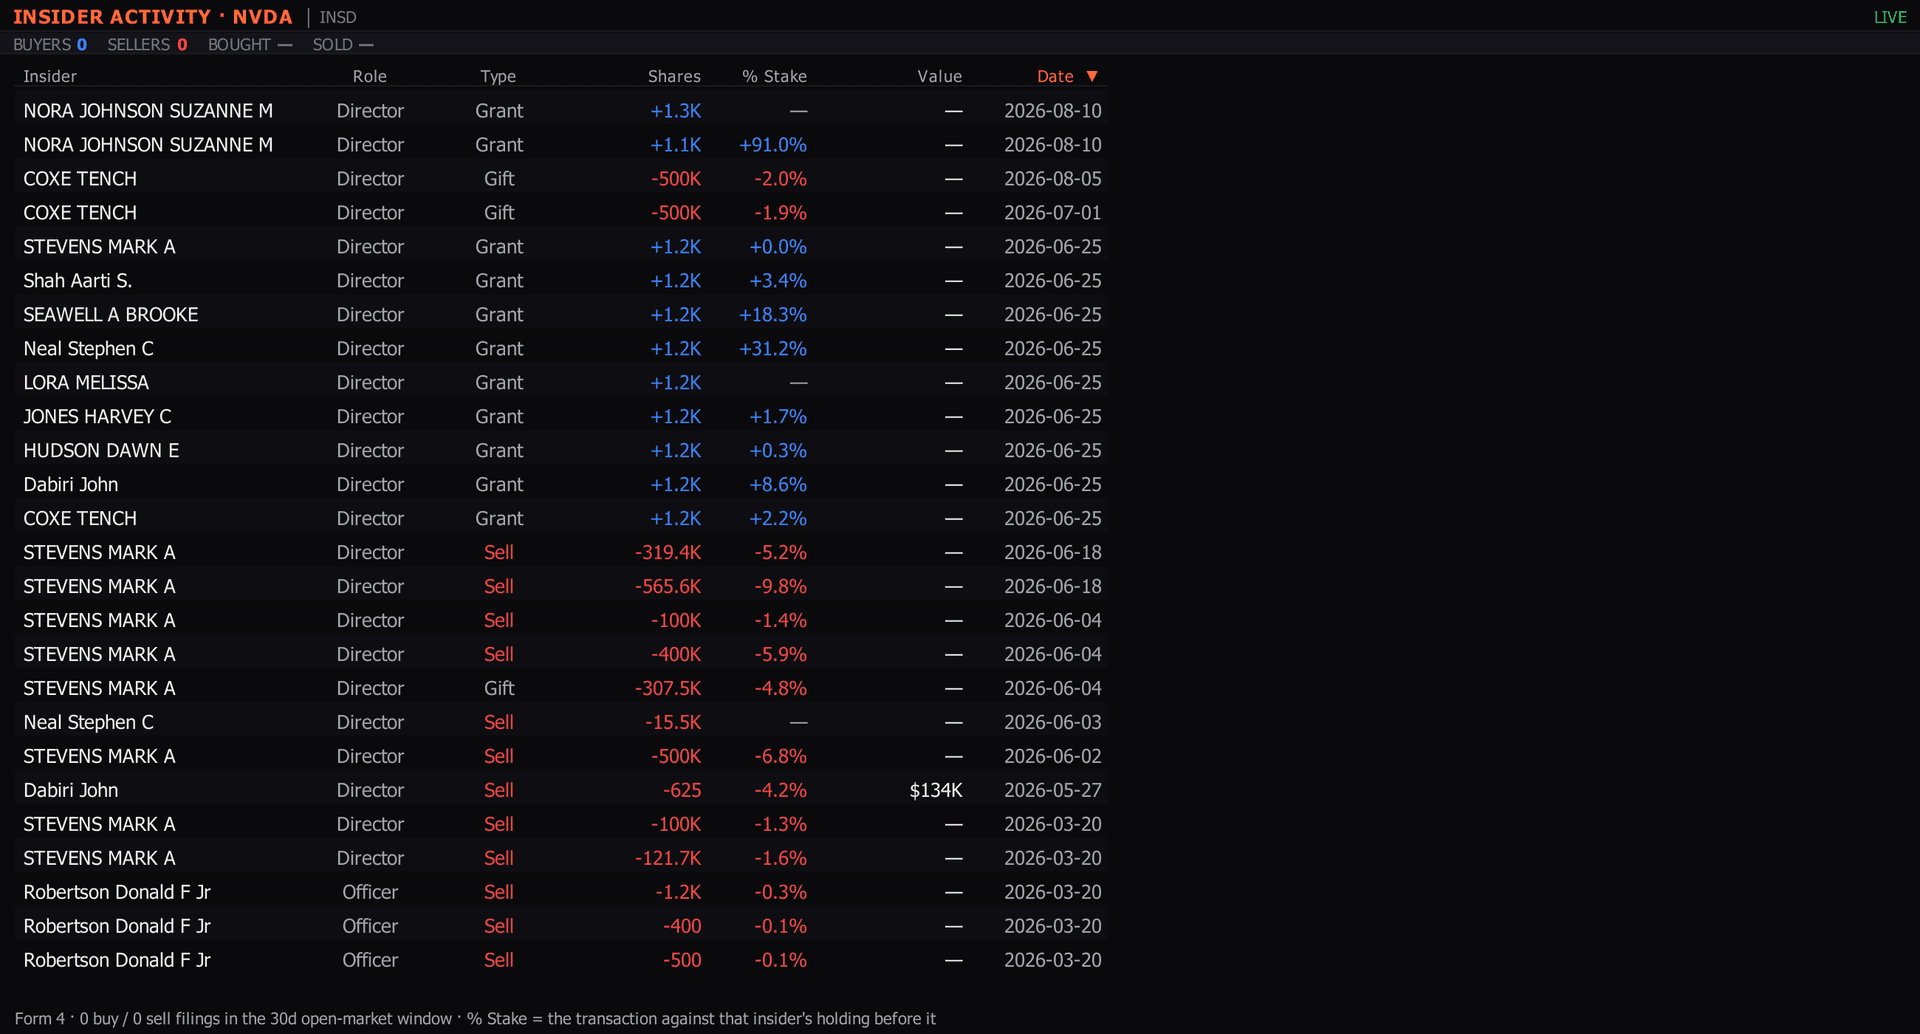
Insider Form 4s · the actual panel, live data
Open a company and the desk assembles around it: as-filed income, balance and cash-flow statements up to eight quarters across, Piotroski F-score and Altman Z-score with every component shown — computed from SEC documents, not a vendor's summary of them.
13F institutional holders with share counts and direction — who added, who cut, quarter over quarter. Insider Form 4 activity on the chart's own time axis, so "the CFO sold" and "what the tape did that day" are one glance.
The filed subsidiary structure — every entity the company registers, by jurisdiction — plus counterparties named in its own 10-K and disclosed customer concentration. The reading an analyst does in an afternoon, already done.
Material 8-Ks and dilution filings (424B5, S-1, S-3) land on the desk the moment EDGAR accepts them — ahead of the newswires. This year's 10-K red-lined against last year's, risk factor by risk factor.
For the liquid option names the engine computes nightly — the Mag 7, the big China ADRs and more — the stock's own call wall, put wall and gamma flip sit on its chart, same as the index desk.
Intel Clearance holders get the nightly screen in the terminal: every scanned stock scored 0–100 — signal, positioning, fundamentals, 13F momentum, short-flow and dark-pool builds — with the exact components printed next to the score.
The research itself is free to read for 1,600+ companies — no account, no card. The desk that turns it into a working screen, with live charts and the dealer walls, is the terminal.
